Poverty in Australia 2022: A snapshot
The Poverty in Australia 2022 snapshot is the latest in our Poverty in Australia series, part of the Poverty and Inequality Partnership between ACOSS and UNSW Sydney.1The companion publication, ‘Inequality in Australia’ profiles income and wealth inequality. It is the 18th report published by the Partnership and the 1st report from Phase 2 of the Partnership.
This report provides a brief overview of levels of poverty – overall and among adults and children – following the recent release of Australian Bureau of Statistics (ABS) data on household incomes in 2019-20. It examines trends in poverty since 1999, and through each quarter of 2019-20. While it is unusual to measure changes in poverty on a three-monthly rather than annual basis, it was a very unusual year.
In the second quarter of 2020 COVID-19 lockdowns triggered a sharp recession and the government introduced unprecedented public income supports to keep household and business incomes afloat. As we argued in a previous Poverty and Inequality Report released in 2021, these two factors worked in opposite directions: the recession and widespread job losses increased poverty while the COVID income supports reduced it.
This report reveals the overall impact of the pandemic recession and temporary increase to income support on poverty (noting that the COVID income supports introduced in the June quarter of 2020 were later withdrawn). As with previous publications in our Poverty and Inequality in Australia series, this report will be followed by a more detailed examination of poverty levels among different groups in the community and their likely causes.
We are grateful for the support we receive for this partnership and would like to thank the organisations and philanthropists supporting Phase 2: 54 reasons (part of the Save the Children Australia Group), ARACY, Brotherhood of St. Laurence, cohealth (a Victorian community health service), Good Shepherd Australia New Zealand, Foodbank Australia, Jesuit Social Services, Life Without Barriers, Mission Australia, Settlement Services International and The Smith Family; with philanthropic partners Hart-line and the Social Justice Fund, both sub-funds of Australian Communities Foundation, and John Mitchell.
We gratefully acknowledge the leadership of UNSW President and Vice Chancellor Professor Attila Brungs along with UNSW Deputy Vice-Chancellor Inclusion and Diversity Professor Eileen Baldry in championing this initiative, along with the ACOSS Board. Without the support of our partners and supporters, this research would not be possible.

Cassandra Goldie, ACOSS CEO & Carla Treloar, Director, Social Policy Research Centre, UNSW Sydney
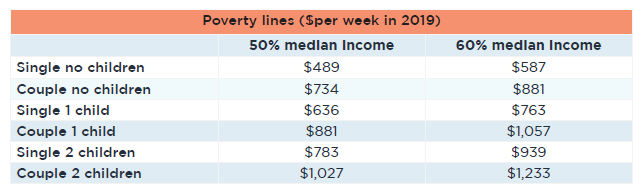
- The poverty line (based on 50% of median household after-tax income) is $489 a week for a single adult and $1,027 a week for a couple with two children, based on the latest data from the ABS.
- More than one in eight people in Australia (13.4%) lived below the poverty line in 2019-20, the first year of the pandemic. That amounts to 3,319,000 people.
- One in six children (16.6%) live in poverty. That amounts to 761,000 children.
- The poverty rate soared to 14.6 per cent in the March quarter of 2020 due to Covid-19 restrictions.
- But it fell to 12% – a 17 year low – in the June quarter of 2020 due to boosted income support payments.
- The boosted payments brought 646,000 people – or 2.6% of all people – out of poverty.
- The child poverty rate rose from 16.2% in the September quarter of 2019 to 19% in the March quarter of 2020. It then fell to 13.7% – a two-decade low – in June 2020.
- Average weekly incomes of people in poverty (from different-sized families) are $304 below the poverty line. This is known as the poverty gap.
- The poverty gap increased steadily from $168 a week in 1999 to $323 in March 2020 and then fell to $310 in June 2020 due to the extra Covid-19 income support.
- Boosted income support pushed weekly social security payments for single adults with no private income from $134 below the poverty line to $146 above it. Single parents with two children went from $119 below to $176 above the poverty line. Couples with no children went from being $152 below to $411 above the poverty line while couples with two children went from being $187 below the poverty line to $361 above it.
One in eight people, including one in six children, live below the poverty line according to the latest data (2019-20)
Using the latest data available from the ABS (2019-20), we find that:
- The poverty line based on 50% of median household income ranges from $489 per week for a single person to $1,027 per week for a couple with two children.
- More than one in eight people (13.4%) and one in six children (16.6%) live below the poverty line after taking account of housing costs.
- In total, there are over three million (3,319,000) people in poverty, including 761,000 children.
- People in households below the poverty line have incomes that average $304 per week below the poverty line (the ‘poverty gap’), after deducting housing costs. The average poverty gap is 42% of the poverty line.2This average figure is not adjusted for household size, so it is increased by the larger poverty gaps of people in larger households. The average poverty gap for single people living in poverty would be lower.
Poverty rose, then fell sharply during the COVID-19 recession in 2020
Lockdowns imposed in response to the COVID-19 pandemic triggered a deep economic downturn commencing in the March quarter of 2020. The recession, and government income supports introduced at this time, led to dramatic shifts in poverty during 2019-20:
- Poverty rose from 13.2% in the September quarter of 2019 to 14.6% in the March quarter of 2020. It then fell to 12% – a 17 year low – in the June quarter of 2020.
- Child poverty rose from 16.2% in the September quarter of 2019 to 19% in the March quarter of 2020. It then fell to 13.7% – a 20 year low – in June 2020.
- The average poverty gap rose from $291 per week in September 2019 to $323 in March 2020, then fell to $310 in June 2020.
New social security payments introduced at the outset of the COVID-19 recession lifted the incomes of people on pensions to just below the poverty line and those of people on unemployment payments well above it.
Between the March and June quarters of 2020, new income support payments lifted 646,000 people out of poverty, including 245,000 children.
In April 2020, the $750 lump sum Economic Support Payment lifted pensions closer to the poverty line:
- Social security payments for single people receiving pensions rose from being $19 to $4 per week below the poverty line;
- Payments for couples receiving pensions rose from being $25 to $3 per week below the poverty line (based on combined income).
In April 2020, the Coronavirus Supplement (initially $275) together with the lump sum Economic Support Payment dramatically boosted income support for people on JobSeeker Payment, Youth Allowance and Parenting Payment, lifting people on these payments from well below the poverty line to well above it:
- Social security payments for single people receiving JobSeeker Payment rose from being $134 per week below the poverty line to $146 per week above it;
- Payments for couples receiving JobSeeker Payment rose from being $152 per week below the poverty line to $411 per week above it;
- Payments for sole parents with one child receiving JobSeeker Payment rose from being $67 per week below the poverty line to $228 per week above it.
As we reported in a previous Poverty and Inequality report, these and other COVID-19 income support payments sharply reduced financial stress despite the recession. Many people on the lowest payments found that they could eat three full meals a day and pay their rent and utility bills on time for the first time since they started receiving income support.
But reductions in poverty for people on the lowest payments were short-lived
The Coronavirus Supplement was abolished in March 2021, in conjunction with a much smaller $25 per week ongoing increase in JobSeeker Payment.
While this is beyond the scope of the ABS household income data on which we rely in this report, we concluded in a previous report that poverty was likely to rise above pre-pandemic levels during 2021 after the Supplement was withdrawn, since a much larger number of people relied on the lowest income support payments than before the pandemic:
- In April 2021, 1,950,000 people received income support payments that previously attracted the Coronavirus Supplement, compared with 1,414,000 people in February 2020.3Davidson P (2021), op cit. Philips et al (2020) estimated that the overall poverty rate would rise from 11.5% in 2019 (before the pandemic) to 14% in January 2021 when the Coronavirus Supplement was still in place but at the much lower rate of $75 per week (Philips et al 2020, COVID-19 JobKeeper and JobSeeker impacts on poverty and housing stress. ANU Centre for Social Research and Methods).
The Coronavirus Supplement could have been better designed to reduce poverty
As the Coronavirus Supplement was introduced rapidly as an emergency measure after nationwide ‘lockdowns’ were imposed to prevent the spread of COVID-1919, its design was simplistic:
- Unlike pensions, it was paid at twice the rate for couples compared to singles, ignoring economies of scale for adults living together;
- It did not include an allowance for children or housing costs.
Consequently, the Supplement had a greater impact on the incomes of couples than singles, and people without children than those with children:
- The Supplement for couples equalled 75% of the poverty line, compared with 56% for singles;
- It equalled 35-43% of the poverty line for sole parents and 54%-62% for couples with children.4The greater impact of COVID-19 policies on child poverty compared with overall poverty noted above is likely due to the targeting of the largest increases in income support towards people on working-age income support payments, who were more likely than older people to have children.
This suggests that for the same budget outlay, poverty could have been reduced more if the Supplement was better tailored to the needs of different-sized families – for example, if it was less generous for couples without children and more generous for sole parent families.
Poverty lines are benchmarks for the adequacy of incomes to meet the minimum needs of households of different sizes. People whose household’s income lies below the relevant poverty line are unlikely to reach a generally acceptable minimum standard of living unless they have access to other resources such as substantial savings. They are likely to miss out on essentials that most people take for granted such as decent and secure housing.5Saunders & Naidoo (2018), ‘Mapping the Australian Poverty Profile: A Multidimensional Deprivation Approach’. Australian Economic Review, vol. 51, no. 3, pp. 336–50.
In our poverty research we use a variant of the poverty definition adopted by the Organisation for Economic Cooperation and Development (OECD) and many other researchers, in which the poverty line for a single adult living alone is set at half the after-tax income of the median (middle) household in the overall income distribution, including any social security payments received. Higher poverty lines are then calculated for larger households based on the relative expenditure requirements of different-sized households.6OECD (2008), Growing Unequal? Income Distribution and Poverty in OECD Countries. Paris
The ‘50% of median income’ poverty line is widely used as a benchmark for poverty. The European Commission uses a higher poverty line based on 60% of median household disposable income. 7European Commission (2009), Social Inclusion and Income Distribution in the European Union. Brussels Both of these poverty lines for Australia in 2019-20 are shown in Table 1, though in this report we mostly refer to the 50% of median income poverty line.
As explained in the attached methodology briefing, we take account of different households’ access to a key asset required to achieve a decent living standard – their home – to assess whether people are living in poverty. Clearly people who own their home outright require less income to achieve a decent standard of living than those who are renting or paying off a mortgage. To take this into account we reduce these poverty lines by the median cost of housing across the community and then reduce each household’s income by their actual housing costs.
Table 1: Poverty Lines by family type, 2019-20 ($pw after tax, including social security payments)
We report the results of this research in two ways.
- First, we report the number of individuals in households living below each of the 50% and 60% of median income poverty lines. This tells us how many people are living in poverty.
- Second, we calculate ‘poverty gaps’ for people living below the poverty line. This tells us about the depth or severity of poverty: how far below the poverty line are those people in poverty? Trends in the poverty gap are expressed in constant (2019-20) dollars per week, after adjusting for inflation.
One in eight people and one in six children live below the poverty line
More than one in eight people (13.4%) live below the 50% of the median income poverty line after taking account of housing costs (Table 2). 8These are annual estimates for 2019-20, using the 50% of median income poverty line and the latest available ABS data on the distribution of household incomes. The poverty rate among children is much higher at one in six (16.6%). In total, there are over three million (3,319,000) people in poverty, including 761,000 children.9Other poverty researchers have estimated changes in the number of people in poverty through the pandemic in 2019-20. The relevant reports include Philips B et al (2020), Ibid; Duncan A (2022), Behind the lines: the 2022 BCEC Poverty and Disadvantage in Australia report. Bankwest Curtin Economics Centre, Perth; Grudnoff M (2021), Opportunity lost – Half a million Australians in poverty without the coronavirus supplement. Australia Institute. Canberra; and Li J et al (2020), The Impact of COVID-19-19 and Policy Responses on Australian Income Distribution and Poverty. Institute for Governance & Policy Analysis. University of Canberra. All these studies except Duncan (2022) used microsimulation methods to estimate the impact of demographic, labour market and policy changes on poverty in the absence of up-to-date income distribution data. Duncan (2022) used household income data from the 2020 Melbourne Institute Hilda survey.
These studies generally found a reduction of approximately 2 percentage points in overall poverty rates following the introduction of COVID-19 income supports in 2020; apart from Li et al (2020), who found that poverty declined by 3-4 percentage points (the poverty measure used there took account of childcare costs as well as housing costs). (
The average ‘poverty gap’ (the difference between the average incomes of people in poverty and the 50% of median income poverty line), is $304 per week, which is 42% of the poverty line.10Note that this average figure is not adjusted for household size, so it is boosted by the larger poverty gaps of people in larger households. The average poverty gap for single people living in poverty would be significantly less. That is, people in households below the poverty line have incomes that average $304 per week below the line, after deducting housing costs. It is important to measure poverty gaps, because even if the rate of poverty is reduced, this could still leave many people a long way below the poverty line.
Table 2: Number and percentages of people below the 50% and 60% of median income poverty lines, and average poverty gaps (2019-20 dollars per week)
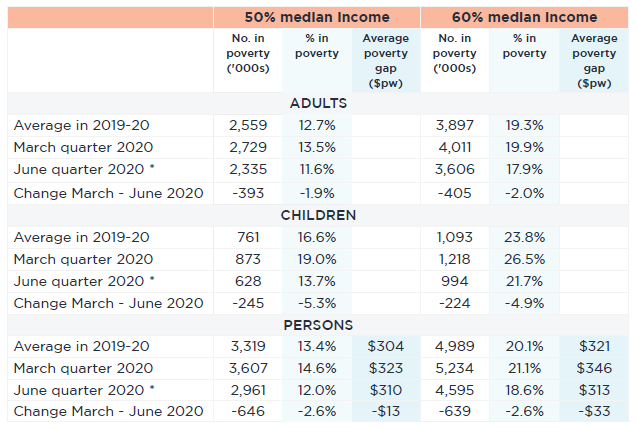
Note: ‘Average poverty gap’ is the difference between the poverty line and the average income of those in poverty (how far they are below the line) in 2019-20 dollars per week.
* Coronavirus Supplement was introduced at this time.
In the June quarter of 2020, COVID-19 income supports reduced poverty by one-sixth or 646,000 people
Table 2 shows that the number of people in poverty fell by 646,000 from 3,606,000 to 2,961,000 between the March and June quarters of 2020. The percentage of people in poverty fell by 2.6 percentage points from 14.6% to 12%.
The number of children in poverty also fell dramatically and the decline was proportionately greater than for poverty among adults. In June 2020 there were 245,000 fewer children in poverty as child poverty declined from 873,000 to 628,000. The rate of child poverty fell by 5.3 percentage points from 19% to 13.7%.
Over the same period, the average poverty gap declined by $13 per week from $323 to $310.
The reasons for this sharp decline in poverty are discussed in Part 4 of this report.
We now turn to trends in poverty among all people over the 20 years from 1999 to 2019, including the four quarters of the 2019-20 financial year from July 2019 to June 2020.
One challenge when measuring trends in poverty in Australia is a series of changes in income definitions applied by the ABS to its income surveys during the 2000s. To overcome this problem, we use two measures:
- the income measure adopted by the ABS in 2005-06 that was similar to those used in previous years and continues to be updated; and
- the most up-to-date measure adopted by the ABS from 2007-08.13 This later measure (which accounts for such factors as employee fringe benefits) is the one we used in Table 2 above to measure poverty in 2019-20.
3.1 Trends in poverty among all people
Figure 1 shows changes in the rate of poverty among all people from 1999 to 2019, based on the two income measures used by the ABS discussed above.
Overall poverty levels rose in the boom years until the Global Financial Crisis (GFC) in 2008, then plateaued from 2008 to 2017
Broadly speaking, poverty declined in the early 2000s, rose in the boom years up to the GFC in 2008, declined around 2009, and then stabilised during the decade prior to the pandemic in 2020:
- The percentage of people in poverty fluctuated in a band between 11% and 16% over this period. Poverty declined substantially from 13.1% in 1999 to 11.5% in 2003, then rose sharply during the boom years to 14.4% in 2007. Following the GFC in 2008 and a pension increase in 2009, it fell to 13.1%, then rose modestly to 13.5% in 2017.
As discussed in a previous ACOSS-UNSW Sydney Poverty in Australia report, trends in poverty from 1999 to 2017 reflected three main factors:
- Rapid growth in median household incomes (on which the poverty line is based) and community living standards up to the GFC in 2008, after which incomes stagnated;
- Growth in housing costs, especially for people on the lowest incomes who rented their homes; and
- Social security policies, especially the indexation of pensions to wage movements (so that they kept up with community living standards), a large pension increase in 2009, and the failure to increase Newstart and related allowance payments beyond movements in the Consumer Price Index so that it fell further behind community living standards.11Davidson, P., Bradbury, B., and Wong, M. (2020), Poverty in Australia 2020: Part 2, Who is affected? ACOSS/UNSW Poverty and Inequality Partnership Report No. 4, Sydney: ACOSS.
Overall poverty rose sharply than fell dramatically during the first year of the pandemic (2019-20)
The right-hand side of Figure 1 shows the dramatic shifts in poverty during the pandemic in 2019-20.
Poverty rose from 13.2% in the September quarter of 2019 to 14.6% in the March quarter of 2020, then fell to 12% – a 17 year low – in the June quarter of 2020.
We discuss the reasons for these shifts in poverty in Part 4 of this report, noting that changes in income support from April 2021 meant that the reduction in poverty described here was unlikely to be sustained.
Figure 1: Percentage of all people in poverty from 1999-2019 (50% of median income poverty line, after deducting housing costs)

Note: The poverty line used is 50% of median income, taking account of housing costs. The lower (dark blue) line shows poverty rates measured using the pre-2007 ABS income definition, while the higher (red) line is based on the post 2007 income definition. The light blue line shows the quarterly changes in poverty rates during the 2019-20 period.
3.2 Trends in poverty among children
Figure 2 shows that poverty among children followed a broadly similar trend to overall poverty but moved within a higher band between 14% and 19% (around three percentage points higher than ‘overall’ poverty as shown in Figure 1).
Child poverty rose in the boom years up to the GFC in 2008, then gradually decreased up to 2017
Along with overall poverty rates, child poverty declined substantially from 1999 to 2003 (from 18.6% to 14.3%), then rose to 18.8% in 2007. It fell gradually to 17.6% in 2017.
Child poverty rose sharply than fell dramatically during the first year of the pandemic (2019-20)
The right side of Figure 2 shows the shifts in child poverty during the pandemic in 2019-20:
- Child poverty rose from 16.2% in the September quarter of 2019 to 19% in the March quarter of 2020, then fell dramatically to 13.7%, a two-decade low, in June 2020.
Figure 2: Percentage of children in poverty from 1999-2019 (50% of median income poverty line, after deducting housing costs)
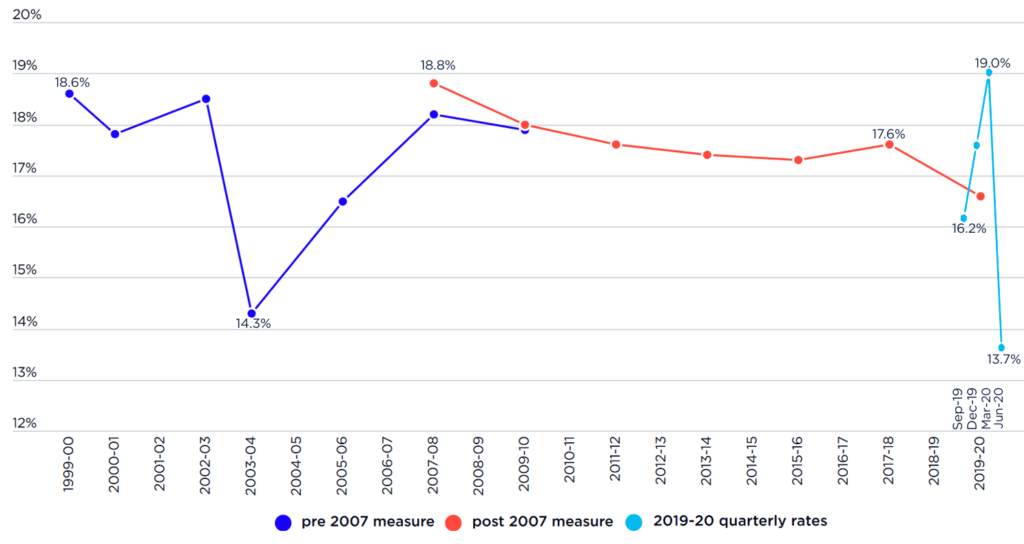
Note: The poverty line used is 50% of median income, taking account of housing costs. The lower (dark blue) line shows poverty rates measured using the pre-2007 ABS income definition, while the higher (red) line is based on the post 2007 income definition. The light blue line shows the quarterly changes in poverty rates during the 2019-20 period.
3.3 Trends in poverty gaps
Figure 3 shows trends in the depth of poverty – the average gap between the household incomes of those in poverty and the poverty line.
The poverty gap rose steadily from 1999 to 2017
The average poverty gap increased steadily from $168 per week in 1999 to $254 per week in 2009 (in constant 2019 values), then rose to $290 per week in 2017.
Over that period the poverty gap followed a different pattern to the poverty rates shown in Figure 2 above. The more persistent rise in the poverty gap reflects a combination of factors working in opposite directions:
- Changes in the composition of people below the poverty line after 2009 reduced the poverty gap before 2009 and increased it afterwards, and these influences were partly offset by increases in housing costs throughout this period.
- Before 2009, a substantial proportion of people below the poverty line relied on the Age Pension, which was just below poverty line. A pension increase in 2009 lifted many older people above the poverty line.
- This meant that a growing proportion of people in poverty were on much lower payments such as Newstart Allowance (whose value declined in comparison with median household incomes as discussed previously), increasing the poverty gap.12Davidson P, Bradbury B & Wong M (2020), op cit.
This shows the need to examine poverty rates and poverty gaps together to gain a full picture of trends in poverty.
The poverty gap rose sharply then fell during the pandemic in 2019-20
The right-hand side of Figure 3 shows changes in the poverty gap over the four quarters of 2019-20:
- The poverty gap rose from $291 per week in September 2019 to $323 in March 2020, then fell to $310 in June 2020. This mirrors the rise and fall of poverty rates throughout that year.
Figure 3: Average poverty gap for all households in poverty from 1999 to 2019 (2019 dollars per week, using the 50% of median income poverty line and deducting housing costs)
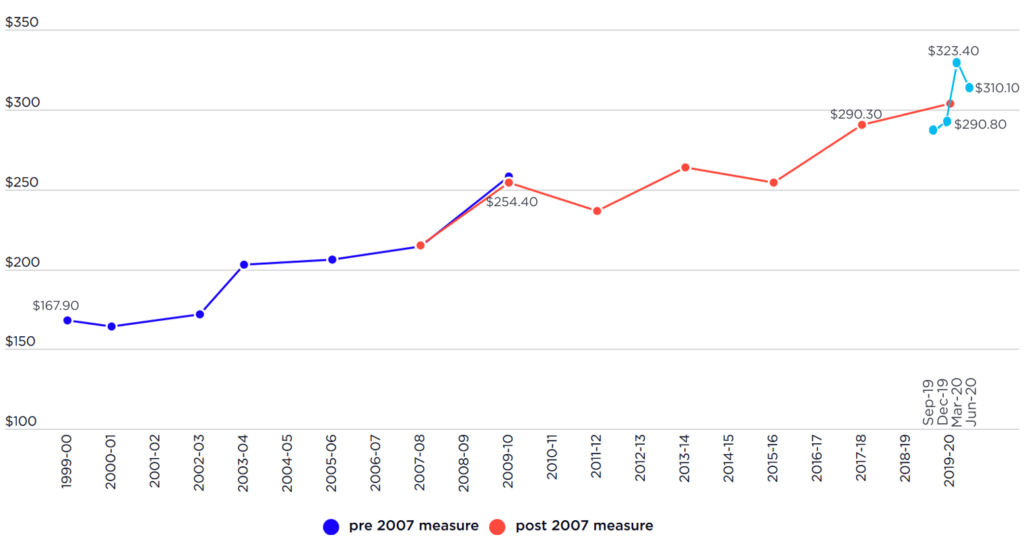
Note: Average gap between the poverty line and the household disposable incomes of people living below it, expressed in 2019-20 dollars per week (not equivalised). The higher (red) line shows poverty gaps measured using the pre-2007 income definition, while the lower (dark blue) line is based on the post 2007 income definition. The light blue line shows the quarterly changes in the poverty gap during the 2019-20 period.
4.1 Social security payments and poverty
The main purpose of social security payments is to prevent poverty, but most people need private income above and beyond social security (wages or investment incomes) to escape it.13Social security payments include income support payments for adults in families with low incomes (divided into the higher pension payments such as Age Pension and lower allowance payments such as Newstart Allowance), Family Tax Benefits for children in low and middle-income families, and supplementary payments such as Rent Assistance for low-income families renting privately.
Table 3 and Figure 4 compare maximum rates of social security payments with poverty lines for different types of families during 2019-20.14Maximum payment rates in this table include Rent Assistance (apart from pension payments since most pensioners are homeowners). Those with Rent Assistance are likely to face higher housing costs (since Rent Assistance is only paid once rents exceed a minimum level) while those without it have lower incomes. In contrast to the poverty gaps shown in Table 2 and Figure 3, the ‘gaps’ between maximum payment rates and poverty lines shown here are based on ‘cameo’ families (fictional example families) relying fully on social security, so they do not take account of the private incomes or housing costs of different families.
At the outset of the pandemic in March 2020, pensions were significantly below the poverty lines and JobSeeker Payment was substantially so.
Table 3 shows that at the outset of the COVID-19 pandemic in Australia in March 2020:
- Maximum pension payments sat $19 per week below the poverty line for singles and $25 per week below it for couples (based on combined income).
- The difference between poverty lines and the payments typically received by people on JobSeeker Payment was much greater. JobSeeker Payment was $134 per week below the poverty line for singles, $152 below it for couples, $67 to $119 below it for sole parents with one or two children respectively, and $136 to $187 below it for couples with children.
COVID-19 income supports lifted people on JobSeeker Payment above the poverty line and brought pensions closer to it.
In June 2020, after the introduction of a $750 lump sum Economic Support Payment for people on income support payments generally including pensions, and a $275 per week Coronavirus Supplement for people on unemployment and related payments, the gaps between social security payments and poverty lines narrowed for those on pensions and were eliminated for people receiving JobSeeker Payment:
- Payments for people on pensions were $4 per week below the poverty line for singles and $3 per week below it for couples.
- Payments for people on JobSeeker Payment were consistently above the poverty line, ranging from $146 per week above it for singles to $411 for couples, $176 to $228 for sole parents with one or two children, and $361 to $413 above it for couples with one or two children.
These substantial increases in social security payments for people on the lowest payments explain much of the sharp reduction in overall poverty and poverty among children between the March and June quarters of 2020 as described previously.
Table 3: Comparison of social security payments and poverty lines for cameo families with no private income through 2019-20
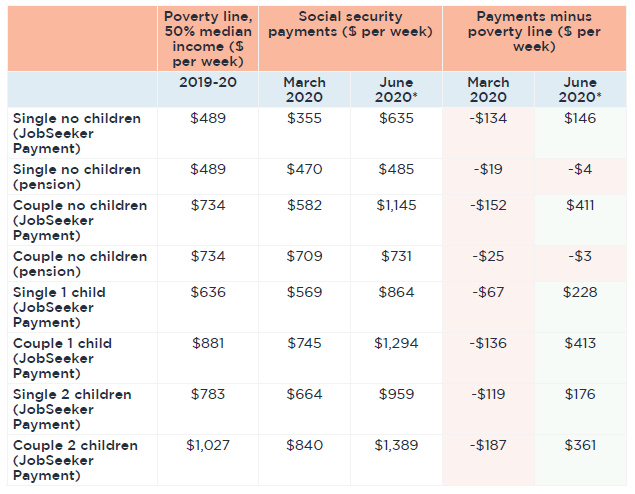
Note: All children are 8-12 years old.
* The $275 per week Coronavirus Supplement and $750 lump sum Economic Support Payment were introduced at this time.
Payments for those on pensions include the pension, pension Supplement, energy Supplement, and Economic Support Payment (in the June quarter of 2020), but not Rent Assistance in these cameos as they are less likely to rent.
Payments for those on JobSeeker Payment include energy Supplement and Rent Assistance (as they are more likely to rent). Those on JobSeeker Payment (but not pensions) received the Coronavirus Supplement for the first time in the June quarter of 2020.
Figure 4: Poverty lines and social security payments for cameo families with no private income in March and June 2020
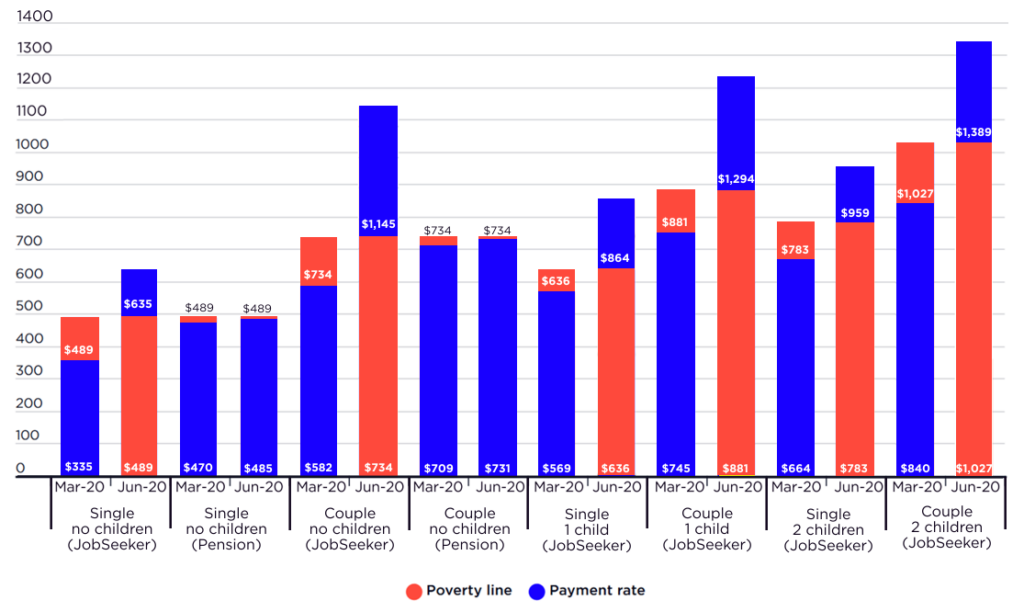
Note: Red shows the poverty line and blue shows the payment rate. If the top of the column is red, this means the payment is below the poverty line. If the top is blue, the payment is above the poverty line.
4.2 The impact of COVID-19 income supports on poverty in 2020
These new income supports dramatically improved the living standards of people on the lowest incomes, as the incomes of people on JobSeeker and related social security payments almost doubled. A regrettable exception was the exclusion of new migrants and people on temporary visas, many of whom were denied income support though they had no choice but to remain in Australia and no source of income.15Refugee Council of Australia and others, Open letter to the Prime Minister. 20 April 2021.
In a previous report on inequality and poverty in Australia, we showed that levels of financial stress and hardship declined sharply at this time. Many people reported that they could eat three full meals a day and pay their rent and utility bills on time for the first time since they started receiving income support.16Davidson P (2021), op cit.
The Coronavirus Supplement had the greatest overall impact on poverty
Table 4 shows the impact of three key changes to income support introduced to support those on social security payments during the COVID-19 lockdowns in 2020 for the same cameo families as in Table 3, expressed in dollars per week and as a percentage of the relevant poverty line.17Payments attracting Coronavirus Supplement included JobSeeker Payment, Youth Allowance, Parenting Payment and Social Benefit. For details see Ferlitsch P (2022), Changes to Australian income support settings during the COVID-19-19 pandemic. TTPI – Working Paper 11/2022. A $750 per week JobKeeper wage subsidy was paid to employers to support the incomes of workers at risk of being laid off during lockdowns and keep them connected with their employers. Its impact on poverty is not assessed here.
1. In the June quarter of 2020, the $750 Economic Support Payment:
- was paid to all current recipients of income support as a one-off quarterly payment of $750, equivalent to $58 per week;18A second payment was made in the September quarter of 2020, but recipients of Coronavirus Supplement were excluded.
- reduced the gap between pension payments and the poverty line but did not eliminate it.
2. In the June quarter of 2020, the $275 per week Coronavirus Supplement:
- was paid to people on working-age income support payments with a connection to the labour market including JobSeeker Payment, Youth Allowance and Parenting Payment;
- did not extend to people on Age Pension, Disability Support Pension or Carer Payment on the grounds that recipients of those payments were less impacted by the loss of employment opportunities during lockdowns;
- was worth twice as much for couples as for single people, while the poverty line for couples is 1.5 times the level for singles reflecting economies of scale for adults living together; and
- did not include an allowance for children.
3. From September 2020 the Coronavirus Supplement was progressively reduced and in April 2021 it was abolished and JobSeeker Payment, along with other payments including Youth Allowance and Parenting Payment, were permanently increased by $25 per week.
- This meant a net $250 per week cut in income support payments for those affected ($500 a week in the case of couples).
Table 4 shows the impact of three key changes to income support introduced to support those on social security payments during the COVID-19 lockdowns in 2020 for the same cameo families as in Table 3, expressed in dollars per week and as a percentage of the relevant poverty line.
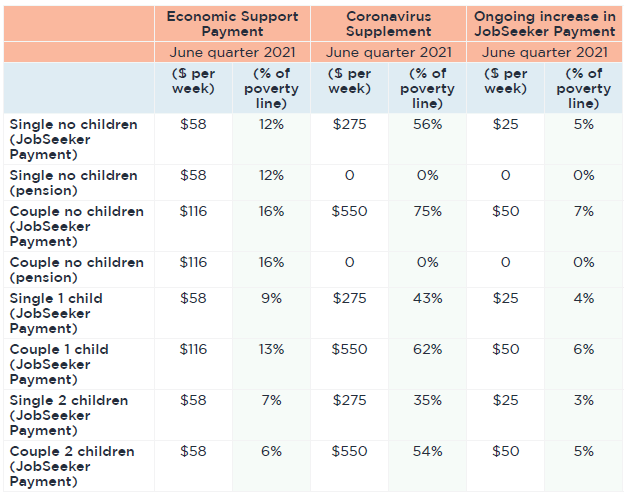
The Coronavirus Supplement could have been better targeted to reduce poverty
Table 4 suggests that the largest of these payments, the Coronavirus Supplement, had the greatest impact on poverty among couples without children on JobSeeker Payment (being set at 75% of the poverty line) followed by single people without children on that payment (56% of the poverty line).
The Supplement also substantially reduced poverty among couples and sole parents on JobSeeker Payment with one or two children, but to a lesser degree. It was equal to:
- 43% of the poverty line for sole parents with one child and 35% for those with two children;
- 62% of the poverty line for couples with one child and 54% for those with two.
The lack of a child supplement thus diminished its impact on poverty among larger families.
These inconsistent impacts on different families were due to the simplistic design of the Supplement, which took little account of the relative needs of different-sized families as it was introduced rapidly in response to an emergency. For the same budget outlay, poverty could have been reduced more if the Supplement was better tailored to the needs of different-sized families – for example, if it was less generous for couples without children and more generous for sole parent families.
Reductions in poverty for people on the lowest payments were short-lived
As indicated, the Coronavirus Supplement was abolished in March 2021 in conjunction with a much smaller $25 per week ongoing increase in JobSeeker Payment.
The impact of the removal of the Coronavirus Supplement for people on JobSeeker Payment is beyond the scope of this report, as the ABS household income data on which we rely only covers the period up to June 2020.
However, we concluded in a previous report that poverty was likely to rise above pre-pandemic levels during 2021 after the Supplement was withdrawn, since a much larger number of people relied on the lowest income support payments than prior to the pandemic:
- In April 2021 1,950,000 people received income support payments that previously attracted the Coronavirus Supplement, compared with 1,414,000 people in February 2020.19Davidson P (2021) op cit. Philips et al (2021) op cit estimated that the overall poverty rate would rise from 11.5% in 2019 (before the pandemic) to 14% in January 2021 when the Coronavirus Supplement was still in place but at the much lower rate of $75 per week.
For the purpose of this report, people are in poverty when their household’s disposable income (after deducting income tax, the medicare levy and housing costs) falls below a level considered adequate to achieve an acceptable standard of living. Rather than measure living standards directly (for example, by asking people whether they have to go without necessities), we set a benchmark for the adequacy of household incomes of one-half (50%) of the median or ‘middle’ household disposable income.20The 50% of median income poverty line is used by the OECD, while the higher 60% of median income poverty line is used by the European Union (though neither take account of housing costs). Australia does not currently have an official national poverty line, despite our obligation under the Sustainable Development Goals to ‘by 2030, reduce at least by half the proportion of men, women and children of all ages living in poverty in all its dimensions according to national definitions. See: https://www.un.org/sustainabledevelopment/poverty/. This is the ‘poverty line’. For comparative purposes, we also report the number of people who fall below a higher poverty line set at 60% of median household disposable income. All incomes and housing costs are adjusted by the quarterly Consumer Price Index (CPI) to average 2019-20 levels. We use the same (price adjusted) poverty line for each quarter of 2019-20 when estimating quarterly poverty rates.
In this way, we measure poverty by comparing the spending capacity of people with low incomes with that of ‘middle Australia’. This takes account of the fact that perceptions of an acceptable standard of living varies over time and between countries as living standards rise or fall. One example is the ability of families to connect with the world using mobile phones or the internet. Similarly, minimum standards for housing have changed over time – such as access to an indoor toilet.
It does not follow that these poverty measures are simply measuring overall inequality, or that poverty cannot be eliminated while income inequality exists. It can be eliminated by lifting the lowest incomes (including social security payments, paid working hours and minimum wages) to at least half the median level. Poverty levels vary over time within Australia in response to policy changes such as the increase in pensions in 2009.
People’s spending power is affected by more than their incomes. This report also takes account of two factors that have a large impact on the ability of a household to live decently at a given level of income.
First, we adjust (or ‘equivalise’) disposable incomes to take account of family size (using the ‘modified OECD scale’). Clearly, a couple with two children needs more money to achieve the same living standard than a single person living alone. Poverty lines are adjusted in this way, as illustrated in Table 1. So, the 50% of median income poverty line for a single person is $489pw in 2019, and that for a couple with two children is $1,027pw.
Second, we take account of variations in the largest fixed cost of most low-income households: housing. At a given level of income, outright homeowners can achieve a much higher standard of living than most tenants or people with mortgages because their housing costs are lower. This is especially important when measuring poverty among older people.
To take housing costs into account, the poverty lines in Table 1 are adjusted downwards by subtracting housing costs from disposable income before calculating the median household income. These lower poverty lines represent the amount of money needed to buy all other essentials after housing is paid for. The poverty status of each household is established by deducting its housing costs from its disposable income and comparing the remaining amount with the adjusted poverty line.
Finally, because of concerns about the accuracy of income survey measurement of income, we exclude households containing self-employed people and households with zero or negative income from our analysis. Estimates of numbers of people poor are calculated by assuming that these excluded people have the same poverty rate as the remaining population.
ISSN: 1326 7124
ISBN: 978 0 85871 099 3
Poverty in Australia 2022: A snapshot is published by the Australian Council of Social Service, in partnership with UNSW Sydney
Locked Bag 4777
Strawberry Hills, NSW 2012
Australia
Email: [email protected]
Website: www.acoss.org.au
© Australian Council of Social Service and UNSW Sydney
This publication is copyright. Apart from fair dealing for the purpose of private study, research, criticism or review, as permitted under the Copyright Act, no part may be reproduced by any process without written permission. Enquiries should be directed to the Publications Officer, Australian Council of Social Service. Copies are available from the address above.
About this report: Poverty in Australia 2022: A snapshot is the latest in the Poverty in Australia series, part of the Poverty and Inequality Partnership between ACOSS and UNSW Sydney. Find out more at
http://povertyandinequality.acoss.org.au
This report was drafted by Peter Davidson, Bruce Bradbury and Melissa Wong.
Suggested citation: Davidson, P; Bradbury, B; and Wong, M (2022) Poverty in Australia 2022: A snapshot Australian Council of Social Service (ACOSS) and UNSW Sydney.
All photos © Austockphoto. Photos are representative only.
With thanks to our partners: