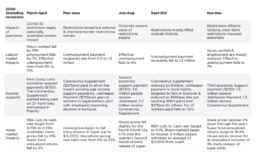
Timeline of the pandemic impacts and policy responses
This table shows the impacts of the pandemic in terms of restriction, employment, income support measures and the impacts on the asset market, both during the COVID recession period in 2020 and during the 2021 economic recovery period.
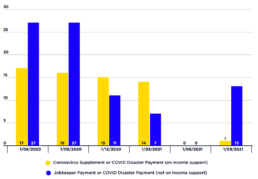
Recipients of Coronavirus Supplement, Jobkeeper Payment and COVID Disaster Payments (% of labour force)
This graph shows that, during the COVID recession in June 2020, 2.2 million people on working-age income support payments (equal to 17% of the labour force) received the Coronavirus Supplement and 3.6 million people who were still employed (equal to 27% of the labour force) received JobKeeper Payment.
These two COVID payments were reduced in late 2020 and removed in April 2021.
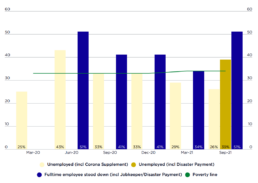
COVID income support for unemployed & fulltime employees (% of median fulltime wage)
This graph compares the poverty line for a single adult living alone with maximum rates of JobSeeker Payment together with Rent Assistance and the Coronavirus Supplement, JobKeeper Payment, and the COVID-19 Disaster Payment, which was introduced in the second wave of the pandemic. All values are expressed as a proportion of the median weekly fulltime wage.
The income supports available to a single adult without children who was unemployed were set above the poverty line in the recession, but drifted below it as the Coronavirus Supplement was reduced:
* In June 2020 (when the Supplement was $275pw) their income was around 30% above the poverty line.
* In September 2020 (after it was reduced to $125pw) they were close to the poverty line.
* In March 2021 (after it was reduced to $75pw), they were around 15% below it.
* In June 2021, (after the $25pw increase in Jobseeker Payment in April 2021 failed to offset the removal of the Supplement) they were once again around 30% below the poverty line.
Note that this comparison of payments and poverty lines for a single adult does not take account of the diversity of families of different sizes and housing costs, which also determine whether a household falls below the poverty line.

Comparison of poverty rates measured before and after housing costs
This graph allows us to gauge the impact of trends in housing costs on poverty.
The difference in poverty rates measured using these two poverty lines shrunk from 3.5 percentage points in 1999 to 2.1 percentage points in 2007. This suggests that the increase in poverty during that period was mainly due to greater disparities between low and middle-incomes, rather than changes in housing costs. After 2007, this pattern was reversed. The difference in poverty rates measured using the two poverty lines grew from 2.1 percentage points in 2007 to 4.7 percentage points in 2017. This suggests that the stabilisation of poverty rates after 2007 when housing costs were deducted from incomes (red line - top) was mainly due to increasing disparities in the housing costs of low and middle income households. As shown by the blue (lower) line, poverty declined over this period when measured before deducting housing costs. So, increasing disparities in housing costs played a major role in keeping the overall poverty rate at around 12-13% from 2009 to 2017, when it would otherwise have declined.
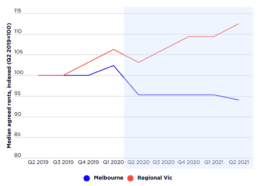
Median agreed rents, indexed - NSW & Victoria 2019-2021
These detailed two-year trends for NSW and Victoria relate to agreed rents.
Notably, Sydney’s outer suburban trend sharply contrasts from that of inner and middle ring localities. Rents in outer Sydney have been tracking along a trajectory much more similar to regional NSW (other than Newcastle). It could be that this is partly a reflection of changing property type demand during the pandemic. If homes for let in inner and middle Sydney are typically units, but most in outer ring suburbs (as in most regional areas) are houses, that could affect aggregate rent trends in a period when house rentals have commanded an unusually large premium.
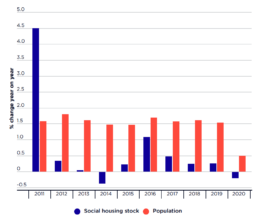
Annual growth rates – social housing stock and population, 2011-2020
For most of the 2010s population growth has run at more than three times the level of social housing expansion.
The first year in this sequence reflects the extraordinary impact of the national Social Housing Initiative (KPMG 2012). Launched in 2009 to counter the Global Financial Crisis, this four-year stimulus investment program represents the only significant addition to the social housing stock of the past 25 years. Across the last decade, however, Australia’s population grew by 16% whereas – even with 2010 as the base year – social housing expanded by only 7%. In the second half of the 2010s population growth outstripped social housing growth more than threefold – 7% versus 2%. Similarly, in every year from 2012 onwards, much faster growth in population than in social housing stock meant that the ratio of the former to the latter continued to grow. This was true even in 2020 when population growth was unusually depressed due to the pandemic, but when social housing stock actually diminished.
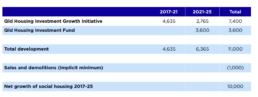
Interpretation of Queensland Government published statistics on social housing construction (dwelling commencements)
On 17 June 2021 the Queensland Government announced a $2.9 billion housing stimulus investment program. This supplements a pre-existing financial commitment to the Government’s 2021-2025 Housing and Homelessness Action Plan. The 2021 funding package involves three separate programs:
- $1.74 billion under the Queensland Housing Investment Growth Initiative (QHIGI) to expand social housing across the state by 2,765 dwellings, substantially involving schemes already planned and designed. Implicitly, this involves capital grants (averaging $629k per dwelling) to community housing organisations (and possibly other providers).
- A $1 billion investment fund (Queensland Housing Investment Fund – QHIF) to generate annual returns estimated at $40 million, implicitly to be channelled into ongoing revenue subsidies to participating housing developer-managers over a number of years. This model appears similar to the NSW Social and Affordable Housing Fund, and also the Victorian Social Housing Growth Fund (Pawson and Milligan 2015; Raynor 2017; Pawson et al. pp287-288). Again, published information suggests that some or all of the program – 3,600 homes to be developed over four years – will be delivered by community housing organisations.
- $60 million to acquire two year leases on 1,000 existing dwellings under the Help to Home program. (Queensland Government,2021a)
Information released alongside the 2021 Queensland Budget also states that there will be ‘7,400 new builds over the next four years under the Queensland Housing Investment Growth Initiative’ (Queensland Government 2021b). This implies that the newly announced funding for 2,765 dwellings will supplement an existing program already funded to develop 4,635 homes.
Attempting to reconcile these various figures suggests that newly constructed homes during the term of the 2017-25 Housing Strategy will total 11,000 (2,765+3,600+4635). Separately, the Queensland Government has also stated that it is ‘increasing the supply of social and affordable housing by almost 10,000 over the life of our Housing Strategy’ (Queensland Government 2021b). This appears to imply that at least 1,000 existing public housing dwellings will be demolished or sold in the course of the 2017-25 Housing Strategy development program.
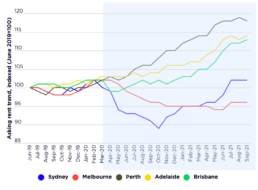
Asking rents for houses and apartments, 2019 - 2021
The differential economic impacts of the COVID-19 pandemic across Australia are apparent in 2020-21 rent trends for the five main capital cities.
Unlike the other cities, Sydney and Melbourne saw significant reductions in asking rents during 2020 in relation to both houses and apartments.
Only by mid-2021 had Sydney house rents recovered to their pre-crisis level. House rents in Melbourne remained almost 5% below their March 2020 values at this time, while apartment rents in both cities were still well over 5% lower than their pre-COVID levels.