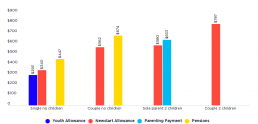
Social security rate structure

This graph shows the structure of social security payments in 2017-18, the year of the income survey on which the data in this website is based. These are not current payment rates. 


New report shows women with caring responsibilities at greater risk of poverty before COVID-19 and highlights risks of ‘snapback’

New analysis of poverty in Australia finds that, before COVID-19, households with children with a female main income earner were more than twice as likely to live in poverty as those in which the main income earner was male, highlighting the impact of caring roles on poverty in Australia. The report also finds that people who were unemployed were at greatest risk of poverty, with two-thirds of people in affected households living below the poverty line. The report’s findings confirm, once again, the inadequacy of pre-COVID payments for people who are unemployed.

The findings lead the Poverty in Australia 2020: Part 2 – Who is affected? report, released today by the Australian Council of Social Service and UNSW Sydney. The report compares the impact of poverty on different people in the community, broken down by age, family type income source, and labour market and housing status. It includes estimates of poverty among people with disability and those from culturally and ethnically diverse communities. The report, which analyses Australian Bureau of Statistics (ABS) data from 2017-18, provides a baseline against which to measure the impact of the current COVID-19 pandemic on poverty in Australia.

Australian Council of Social Service Acting CEO, Jacqueline Phillips, said:

“This report exposes the disproportionate impact of poverty on households in which women are the main income earners. These households are twice as likely to live in poverty as those in which men are the main income earners (19% and 10%, respectively), with the gap even higher in households with children (at 23% and 10% respectively).

“Disturbingly, more than a third of single mothers and their children are living in poverty (37%). The challenges faced by single mothers that lead to so many being on low incomes have serious implications for the wellbeing of those women and their children.

“Early indications suggest that women have been suffering some of the worst economic impacts of the current pandemic, and effective policy action is needed to ensure this does not translate into an ongoing reduction in female employment or an increase in poverty amongst women and children. A snapback on childcare or income support risks trapping single mothers and their children in poverty.”

Poverty rates vary a great deal among different groups. The main reasons for this are also three main drivers of poverty: access to employment, the level of public income support available to people with low or no incomes, and housing costs.

“People who were unemployed were at greatest risk of poverty, with two-thirds of affected households living below the poverty line, highlighting the gross inadequacy of the $40 a day unemployment payment pre-COVID. The doubling of JobSeeker as part of the COVID-19 response has transformed people’s lives. The Government must now ensure that the pathway out of the pandemic is also a pathway out of poverty by setting a permanent income floor above the poverty line,” said Ms Phillips.

“The report reveals that renters are almost twice as likely to live in poverty as home-owners (19% compared with 9%) with public housing tenants at greatest risk (58%). The very high proportion of public housing tenants living in poverty reflects the disadvantage they face, the highly targeted nature of public housing and the low rates of income support payments pre-pandemic.

“The Government can reduce poverty by permanently lifting social security payments above poverty levels, boosting jobs growth, investing in social housing and ensuring that childcare is available for all families who need it for the duration of the economic recovery and beyond.”

The report’s lead researcher, UNSW Sydney Associate Professor Dr Bruce Bradbury, said:

“This report shows the impact that a lack of paid work and having to rely on income support has on poverty. The high poverty rates among income support recipients in 2017-18 point to what will happen to a much wider section of the population if the current COVID-19 income support payments cease in September without an adequate replacement.

“As of January 2018, the single rate of Newstart (plus rent assistance) was $117 below the disposable income poverty line ($185pw if they did not receive Rent Assistance). Consequently, around two thirds of households where the reference person was unemployed were in poverty after taking account of housing costs. Similarly, more than half of households reliant on Parenting Payment were below the poverty line.

“Pension increases in 2009, together with home ownership, mean that only 10 per cent of people aged 65 and above were living below the poverty line. However, among older renters, 41percent had incomes after housing costs which were below the poverty line.”

Professor Carla Treloar, Director of the Social Policy Research Centre at UNSW Sydney, said:

“This report shines a light on those groups most at risk of poverty in Australia and reveals its disproportionate impact on women and children and those who are not currently in paid work.

“The question is, now that we have the data, what will we do to provide the safety net that’s needed to lift these households out of poverty?

“We can see in recent months how doubling unemployment payments has dramatically improved life for people who have lost their jobs.  It’s clear we must continue the action on income support, and devise solutions on housing and job creation to lift more people out of poverty.”

Key facts:

  • Being unemployed remains the greatest poverty risk factor, with two thirds (66%) of people in households in which the main earner is unemployed living below the poverty line. This is directly related to the level of pre-pandemic income support payments.
  • The single rate of Newstart in January 2018 (including Rent Assistance and Energy Supplement) was $117pw below the poverty line ($185pw if they did not receive Rent Assistance). Youth Allowance (plus these supplements) was $164pw below the poverty line ($232pw without Rent Assistance).
  • Households that have to rely mainly on social security payments (e.g. unemployment, parenting, and disability payments) are five times more likely to experience poverty (36%) than those receiving most income from wages and salaries (7%). However, 38% of those in poverty are in wage-earning households; the majority of whom are households with children.
  • In households where the main earner is a female, the poverty rate is 19% – almost double the rate when the main earner is male – 10%.
  • In single parent families in which the main earner is a woman the rate of poverty (37%) is twice that in which the main earner is a man (18%).
  • The biggest differences in poverty rates between households with male and female main earners are in families with children. The average poverty rate among people in families with children where the main income-earner is female is 23%, compared with 10% where the main income-earner is male (which is the more common arrangement). In contrast, among households without children, the average poverty rate where the main income-earner is female is 12%, compared with 10% where the main income-earner is male.
  • Nearly half the children in sole parent families live in poverty (44%) compared with 13% for children living with both parents.
  • While those of working age are at greater risk of poverty than older people, over 65s who are living in private rental face a relatively high risk of poverty (41%).
  •  Renters are almost twice as likely to live in poverty as home-owners (19% compared with 9%) with public housing tenants at greatest risk (58%).

Read the report at: https://bit.ly/PovinAuspt2


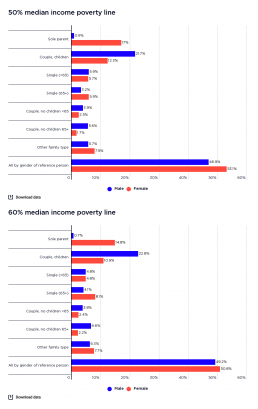
Profile of poverty by gender of household reference person

This graph shows the household types of people in poverty by gender of household reference person.

It shows that shows that among people in poverty in older single-person households (65 years and over), women greatly outnumber men (comprising 6% of all people in poverty when the 50% of median income poverty line is used, and 8% using the 60% median income poverty line; compared with 3% who are older single men - 4% using the 60% median income poverty line). However, among people in poverty in older couple households, more are found in households with a male main earner (comprising 6% of all people in poverty according to the 50% median income poverty line and 7% according to the 60% median income poverty line, compared with 2% in older couple households with a female main earner according to both poverty lines), reflecting the predominance of couples with a male main earner in that age group.


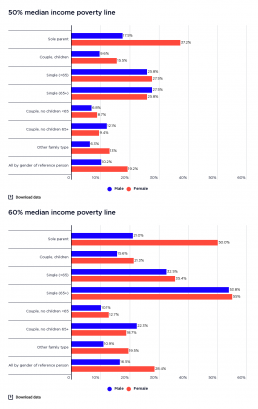
Rate of poverty by gender of household reference person (% of all people)

This graph shows the rate of poverty according to the gender of the household reference person by household type.

It shows that the rate of poverty in sole parent families where the main earner is female is 37% using the 50% median income poverty line, and 50% using the 60% median income poverty line. This is over twice that of sole parent families where the main earner is male (at 18% using the 50% median income poverty line and 21% using the 60% median income poverty line). It also shows that couple-with-children households where the main earner is female have a rate of poverty far higher than those in which the main earner is male (16% female and 10% male according to the 50% median income poverty line; and 21% female and 16% male according to the 60% median income poverty line).

The graph shows that the differences in poverty rates among households with male and female main earners are not as stark for households without children as for those with children.