Income support policy and poverty trends
Presentation to the Australian Social Policy Conference, September 2019, by Bruce Bradbury, Social Policy Research Centre, UNSW Sydney: Income support policy and poverty trends in 21st century Australia
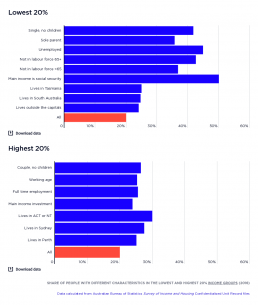
Share of people with different characteristics in the lowest and highest 20% income groups
The first half of this graph shows the share of each group of people with a particular characteristic who are in the lowest 20% income group of households.
Older people, single people and sole parents, and those who rely mainly on government income support payments are more likely to be in the lowest 20% income group.
The most important influence on incomes is labour force status. People living in households where the household reference person is not in the labour force or is unemployed are much more likely to be in the lowest 20% income group.
People living in Tasmania and South Australia are also more likely to be in lowest 20%, along with people living outside capital cities.
The second half of this graph shows that those more likely to be in the highest 20% income group are of working-age and in couple households without children (noting that income is adjusted to take account of the costs of children).
People employed fulltime are more likely to be in the highest 20%, along with those whose main income comes from investments. People living in Sydney, Perth, the ACT or NT are also more likely to be in the highest 20%.
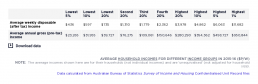
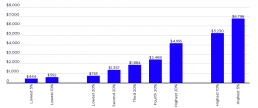
Average household incomes for different income groups
This table shows the average income of households in Australia, split by groups of 20% by income; as well as the highest and lowest 10% and 5% income groups.
2017-18: Somebody in the highest 20% group lives in a household with over twice the average weekly disposable income of the middle 20% ($4,166 per week compared with $1,884), and five times as much disposable income of a household in the lowest 20% ($753 per week). The average income of the middle 20% ($1,884a week) is two and half times that of the lowest 20% ($753). Income is heavily concentrated at the top: average income in the highest 5% (at $5,796) is more than one-and-a-half times the average of the highest 20%.
2015-16: This shows that somebody in the highest 20% group lived in a household with over twice the average weekly disposable income of the middle 20% ($3,978 per week compared with $1,779), and five times as much disposable income of a household in the lowest 20% ($735 per week). The average income of the middle 20% ($1,779 a week) was two and half times that of the lowest 20% ($735). Income is heavily concentrated at the top: average income in the highest 5% (at $6,063) was more than one-and-a-half times the average of the highest 20%, and the average of the top 1% (at $11,682) was almost three times that of the highest 20%. The average disposable income of the highest 1% ($11,682 per week) was more than 26 times that of the bottom 5% ($436). This means that the highest 1% received as much income after tax in a fortnight as the lowest 5% received in a year.

Poverty in Australia: A national perspective
Presentation to the 2019 NTCOSS conference by Jacqueline Phillips, Director of Policy and Advocacy, ACOSS: Poverty in Australia_A national perspective