
New research shows ‘pernicious effects’ of removal of Coronavirus Supplement
A new report from the Poverty and Inequality Partnership led by ACOSS and UNSW Sydney has found that while the Coronavirus Supplement introduced in 2020 gave recipients the breathing space to afford basics such as food and medication, its removal had a pernicious effect that hit hard.
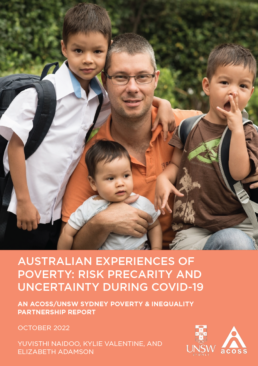
Australian experiences of poverty: risk precarity & uncertainty during COVID-19 found the extra $275 a week from April 2020 was critically important to improving wellbeing during the pandemic.
The qualitative research study, based on phone interviews with 33 income support recipients, revealed the payment provided a reprieve from ongoing financial stresses and allowed recipients to plan for their future for the first time.
But when the supplement was first reduced from September 2020 and then abolished in April 2021, participants were forced to return to acute financial stress and experienced increased feelings of exclusion.
Report authors Professor kylie valentine, Dr Yuvisthi Naidoo and Dr Elizabeth Adamson from UNSW’s Social Policy Research Centre stated that the supplement was “far from [a] bonus payment” but that it "allowed participants to experience something closer to a life without ongoing, debilitating worries about money”. They noted that research participants used the supplement for essentials such as food, medical, personal or household items, to pay off debt and to deal with emergencies.
When the supplement was withdrawn, research participant Jacqui* said she could no longer buy food from Aldi but instead buys expired food from a food pantry, while Sharon said she lives on only one meal a day.
The research found that the benefits of the supplement were enhanced by the temporary relaxation of activity testing and compliance obligations.
The report also found that the COVID-19 pandemic was particularly hard for people who had precarious housing situations and health complications.
Participants said that isolation, anxiety and insufficient income were impacting both physical and mental health, such as Craig who said his mental health took a “rapid decline”.
Lucy said that COVID-19 made it impossible to maintain her previous quality of life, where she had picked up small pieces of work from various employers: “I felt like I’d diversified my income from all different people. But it was like everything had gone. I never thought I’d get to a point where everything had gone.”
The report also noted that successful emergency initiatives to house people experiencing homelessness showed how access to adequate and affordable housing, with the support of case workers who are adequately resourced to provide the services needed, is able to transform lives. Several participants said their case workers went above and beyond to connect them to community support services.
ACOSS CEO Dr Cassandra Goldie said the report showed how the pandemic hit people on low incomes the hardest.
“These compelling human experiences show how tough the experience of poverty can be,” she said. “Australia is one of the wealthiest nations in the world, yet people can’t afford to keep a roof over their head, are eating only one meal a day and buying expired food.
“The report clearly shows how the Coronavirus Supplement provided people with enough to live on for the first time. We must urgently increase income support payments so that they cover the cost of the basics.”
Professor Carla Treloar, Director of UNSW’s Social Policy Research Centre, said the report demonstrated how policy responses made a big impact during the pandemic.
“The response to provide additional financial support, quickly and with few eligibility criteria, was critically important to maintaining people’s wellbeing,” she said.
“The supplement gave people a reprieve from ongoing financial stresses and helped them through difficult social isolation.
“Community service providers also played a major role and helped transform people’s lives by connecting them with accommodation, health and social support.”
People who are living on income support available for interview:
- Melika who struggles to survive on less than JobSeeker with her 6yo daughter near Newcastle
- Michael, a former IT contractor on JobSeeker who has higher food costs due to serious food allergies
- Michelle who is without paid work and lives in social housing in Hobart
An earlier report by the Poverty and Inequality Partnership found that temporary income supports introduced during COVID lockdowns in 2020 – the Coronavirus Supplement and Economic Support Payment – pulled 646,000 people, including 245,000 children, out of poverty.
Key findings:
- People experiencing poverty felt the same pandemic stresses as people with more resources, including concern for older relatives and educating children at home, but the negative effects of isolation hit them harder. For example, their access to the online services that many people used to ease loneliness and stress were restricted.
- The pandemic ‘heightened and worsened’ damaging experiences many already had including isolation and fragile health as many were confined in poor-quality homes.
- Being at home had an impact on expenses, and earlier research found that energy bills increased for some groups living on low incomes. Stay at home orders also increased the risk of domestic and family violence for some people.
- Parenting stress was particularly acute among migrant families because they were more likely to be experiencing financial hardship, ineligible for JobKeeper and found home learning harder.
*Names have been changed

Poverty gaps
This graph shows the average poverty gap for all households in poverty from 1999 to 2019. It is in 2019 dollars, and using the 50% median income after-housing costs poverty line.
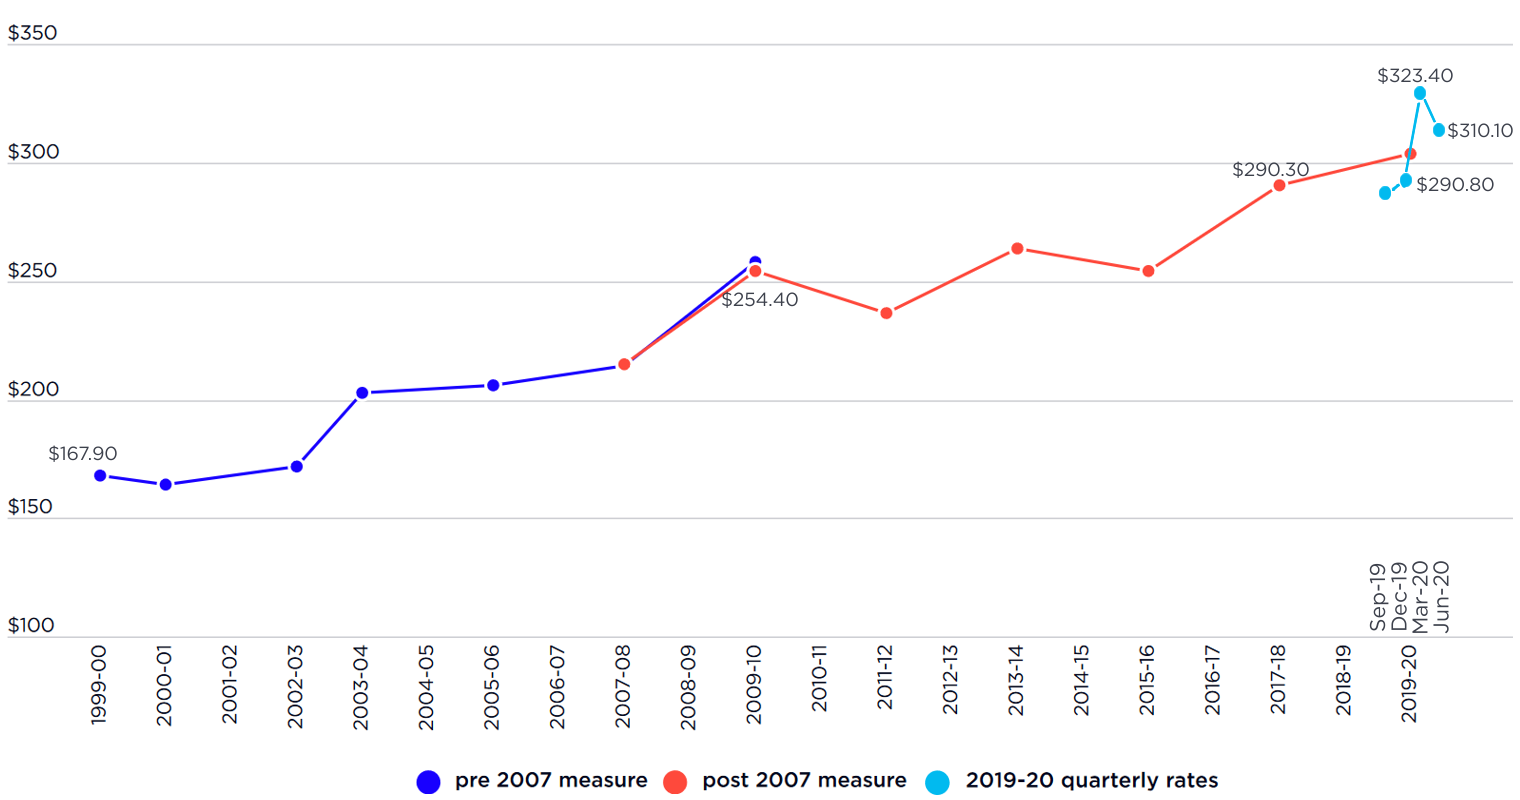
The higher (red) line shows poverty gaps measured using the pre-2007 ABS income definition, while the lower (dark blue) line is based on the post 2007 income definition. The light blue line shows the quarterly changes in the poverty gap during the 2019-20 period.
The average poverty gap increased steadily from $168 per week in 1999 to $254 per week in 2009 (in constant 2019 values), then rose to $290 per week in 2017. Over that period the poverty gap followed a different pattern to the poverty rates during the same period, reflecting a combination of factors working against each other:
* Changes in the composition of people below the poverty line after 2009 reduced the poverty gap before 2009 and increased it afterwards. These influences were partly offset by increases in housing costs throughout this period.
* Before 2009, a substantial proportion of people below the poverty line relied on the Age Pension, which was just below poverty line. A pension increase in 2009 lifted many older people above the poverty line.
* This meant that a growing proportion of people in poverty were on much lower payments such as Newstart Allowance (whose value declined in comparison with median household incomes as discussed previously), increasing the poverty gap.
The right side of the figure (light blue line) shows the changes in the poverty gap over the four quarters of 2019-20. The poverty gap rose from $291 per week in September 2019 to $323 in March 2020, then fell to $310 in June 2020., mirroring the rise and fall of the poverty rates during the same period.
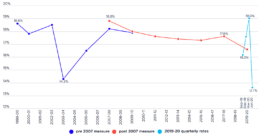
Percentage of children in poverty from 1999-2019
This graph shows the percentage of children in poverty from 1999 - 2019, using the 50% of median income after-housing costs poverty line.
The poverty line used is 50% of median income, taking account of housing costs. The lower (dark blue) line shows poverty rates measured using the pre-2007 ABS income definition, while the higher (red) line is based on the post 2007 income definition. The light blue line shows the quarterly changes in poverty rates during the 2019-20 period.
It shows that child poverty, alongside the overall poverty rates, declined substantially from 1999 to 2003 (from 18.6% to 14.3%), then rose to 18.8% in 2007. It fell gradually to 17.6% in 2017.
It also shows that child poverty rose sharply than fell dramatically during the first year of the pandemic (2019-20); from 16.2% in the September quarter of 2019 to 19% in the March quarter of 2020, then fell to 13.7%, a two-decade low, in June 2020.

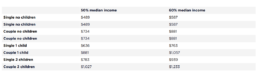
Poverty lines by family type
This table shows poverty lines by family type in dollars per week, including social security payments.

Percentage of all people in poverty from 1999 - 2019
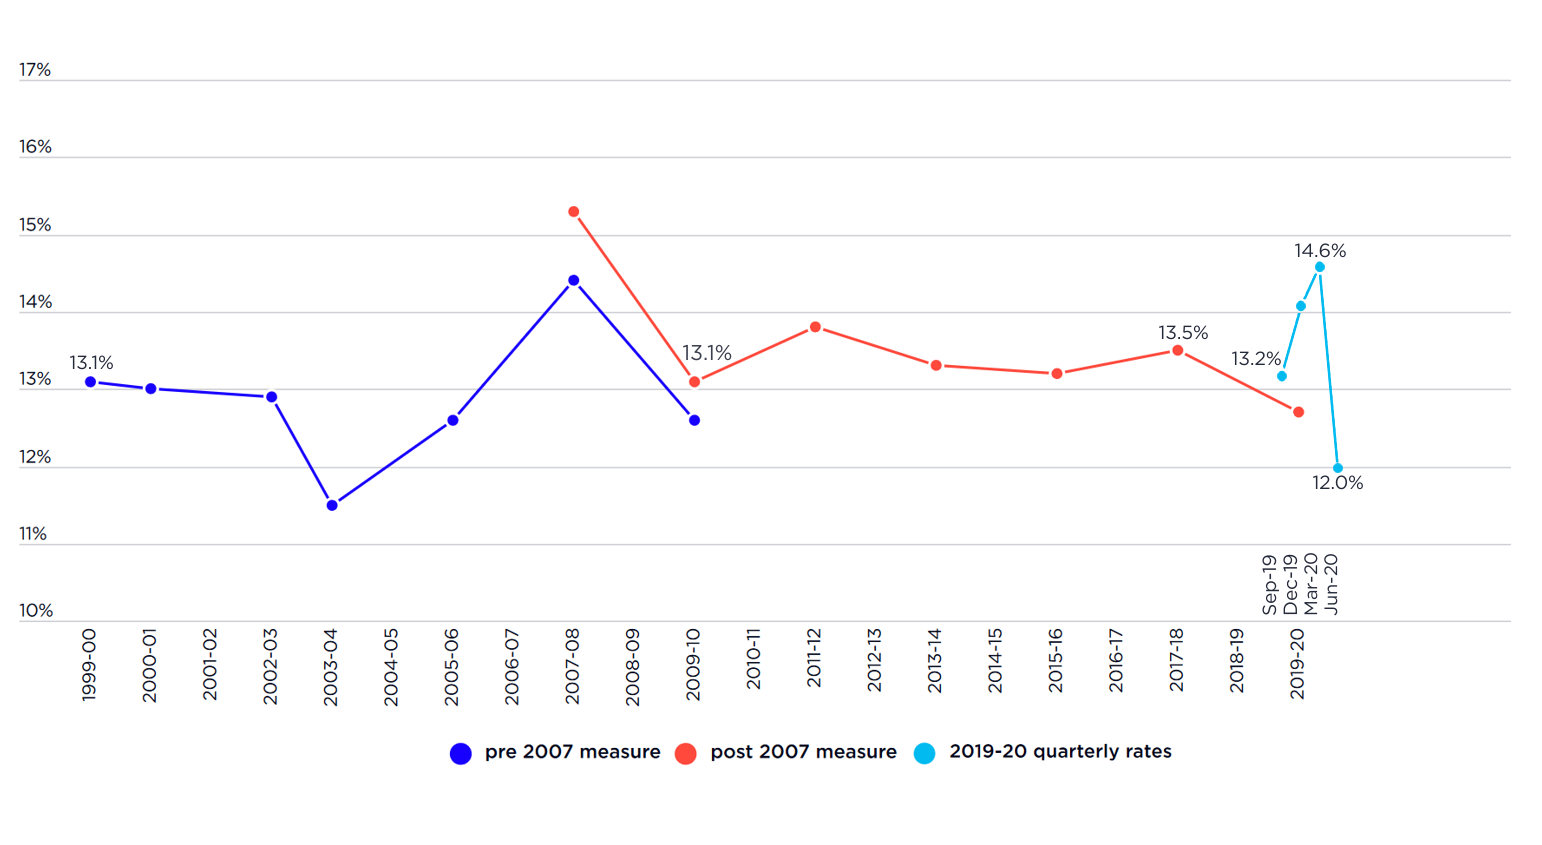
This graph shows the percentage of all people in Australia in poverty from 1999 - 2019. The poverty line used is 50% of median income, taking account of housing costs. The lower (dark blue) line shows poverty rates measured using the pre-2007 ABS income definition, while the higher (red) line is based on the post 2007 income definition. The light blue line shows the quarterly changes in poverty rates during the 2019-20 period, when the impacts of COVID-19 lifted the poverty rate from 13.2% in the September quarter of 2019 to 14.6% in the March quarter of 2020, and the extra coronavirus income support payments introduced meant it fell to 12% - a 17 year low - in the June quarter of 2020.