Gross Domestic Product, real, seasonally adjusted, domestic currency - indexed (Q4 2019=100)
This graph shows that the UK and Spain were more seriously affected economically by COVID-19 than Australia, Canada, Germany, New Zealand and the USA.
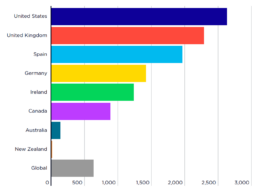
Cumulative COVID-19 deaths per million population (as at 31 January 2022)
This graph shows how many deaths from COVID-19 were experienced per million head of population as at 31 January 2022 for the USA, UK, Spain, Germany, Ireland, Canada, Australia and New Zealand. It also shows the average number of cumulative deaths around the world. It shows how the pandemic has been much more series in the USA, the UK and Spain than in the other northern hemisphere countries.
New ACOSS and UNSW Sydney Report shows how poverty and inequality were dramatically reduced in 2020, but have increased ever since
A new report from the ACOSS/UNSW Sydney Poverty and Inequality Partnership shows that during the first ‘Alpha’ wave of the COVID-19 pandemic in 2020, Australia halved poverty and significantly reduced income inequality, thanks to a raft of Commonwealth Government crisis support payments introduced to help people survive the first lockdown.
It also highlights that over the course of 2021, and throughout the spread of the ‘Delta’ variant, the Federal Government rapidly reversed this extraordinary progress by cutting financial aid and denying it to most people on the lowest incomes.
The latest report from ACOSS and UNSW, Covid, inequality and poverty in 2020 & 2021: How poverty and inequality were reduced in the COVID recession and increased during the recovery examines how people at different income levels fared during those two phases of the COVID-19 Pandemic.
During the first ‘Alpha’ wave of the pandemic, the Coronavirus Supplement and JobKeeper support payments played a crucial role in reducing both income inequality and poverty during the deepest recession in 90 years. Despite an effective unemployment rate of 17% at the time, many people on the lowest incomes could afford to pay their rent and household bills and feed themselves properly for the first time in years.
When lockdowns eased in late 2020, the Government was quick to wind back financial supports. By April 2021 both the Coronavirus Supplement and JobKeeper payments were gone, leaving a yawning gap in pandemic income supports for about a million people still unemployed, when Delta struck later that year.
80% of people on the lowest income support payment were excluded from the COVID Disaster Payment, introduced in September 2021. Subsequently the number of people in poverty rose by around 20% and a bias in jobs growth towards high paid jobs and a rapid rise in investment incomes lifted income inequality.
A few weeks after lockdowns ended, those still out of paid work lost their COVID Disaster Payment and joined the l.7 million people already struggling to get by on the $45 a day unemployment Jobseeker payment. Financial stress came roaring back as did increased reliance on emergency relief.
ACOSS CEO Dr. Cassandra Goldie said:
“The COVID-19 pandemic has taught us that poverty and inequality are not an inevitable state of being. They grow because government policies allow them to, and in many cases, directly increase them.
‘’The income supports introduced during the first COVID wave reduced poverty by half and greatly reduced inequality of incomes. We also showed that good social policy, tackling poverty, is good economics. By targeting income support to those with the least, the vital help was rapidly spent on essentials, helping to keep others in jobs.
“We now know what governments are capable of when they set their minds to it. Instead of taking the opportunity to end poverty in Australia and build our resilience to cope with future crises, the Government reversed the gains made during the first year of the pandemic and failed to adequately plan to mitigate the ongoing health risks.
“Australia’s income support system should sustain people in tough times and help them find suitable employment. At just $45 a day, the unemployment JobSeeker Payment is not up to the task and the Government acknowledged this by almost doubling it. People out of paid work, or without the paid working hours they need, should not have to spend every waking moment worrying about how they will feed themselves and pay the rent.
“Whoever wins the next election will know exactly what levers they need to pull if they wish to end Australian poverty and support jobs. But will they?
“Our response to COVID-19 showed we can end poverty. And when we do, it’s good for all of us. We need candidates, in the lead up to this federal election, to commit to lifting the rate of Jobseeker to at least $69 a day, so that people have the confidence of knowing that they can cover the basics while they are retraining and looking for paid work. Together with investing in social housing, these are the two big levers that could change the face of Australia for good and for the good of us all.
Scientia Professor Carla Treloar, Director of the Social Policy Research (SPRC) and the Centre for Social Research in Health (CSRH) at UNSW, said:
“This research shows that the COVID support payments changed lives. The Government’s decision to take away the Coronavirus supplement and JobKeeper without an adequate substitute, and later on to exclude people on the lowest income-support payments from the COVID disaster payment and prematurely end that payment, locked more people into poverty.
‘’Despite remarkable early progress in reducing poverty and income inequality during the COVID recession, they are both likely to be higher now than before the pandemic. That’s the legacy of the policy response to the COVID pandemic.”
Key Findings:
2020: Alpha wave of COVID and recession:
- Between March and December 2020, the average incomes of the lowest 20% income group rose by 8% ($56pw). Those in the next 20% saw their incomes rise by 11% ($144pw). In contrast the average incomes of the highest 20% fell by 4% ($230pw).
- Between 2019 and the middle of 2020, the percentage of people in poverty fell from 11.8% to 9.9% despite the recession. It would have been twice as high (22.7%) without the COVID income supports.
- Among people in households on the JobSeeker Payment, poverty fell by four-fifths, from 76% in 2019 to 15% in June 2020. Among sole parent families (both adults and children) poverty was reduced by almost half, from 34% to 19%.
- The income support safety net for those on the lowest incomes was buoyed by the $275pw Coronavirus Supplement, 70% of which went to the lowest 40% households by income.
- The JobKeeper wage subsidy of up to $750pw helped sustain the incomes of middle income-earners at risk of losing wages during lockdowns, as 70% of those payments went to the middle 60% of households by income.
2021: Economic recovery and Delta wave of COVID
- In January 2021 the Coronavirus Supplement was cut to $75pw in January 2021, poverty rose to 14%, well above pre-recession levels. The income of a single adult on JobSeeker Payment fell to approximately 15% below the poverty line.
- By April 2021 when the supplement was removed completely, and despite an ongoing increase of $25pw to the lowest income support payments, the new rate of JobSeeker payment fell to approximately 30% below the poverty line and a third of recipients reported increasing difficulty trying to make ends meet.
- By September 2021, COVID-19 Disaster Payments were introduced in response to lockdowns during the Delta wave of the pandemic. This was only paid to people who directly lost paid working hours in a lockdown, and was quickly withdrawn when a lockdown ended.
- Over 80% of people on the lowest income support payments were denied the COVID Disaster Payment, despite the ongoing impact of the pandemic on their employment prospects.
- The JobSeeker Payment was just $391pw and Youth Allowance was just $331pw, well below the poverty line at that time. Around 1.7 million people (around 25% more than before the pandemic in September 2019) relied on these and other income supports set well below poverty levels.
- At the same time, many people on high incomes saw their incomes surge. From August 2020 to August 2021 the number of high-paying jobs rose 251,000 compared to growth in low-paid jobs of 76,000. Investment incomes surged through 2020-21, comprising one quarter of all household income growth in that year. Around two thirds of investment income goes to the highest 20% of households by income.
Read the full report at: https://bit.ly/3LWJtJn
Covid, inequality and poverty in 2020 & 2021: How poverty and inequality were reduced in the COVID recession and increased during the recovery. Build back fairer, report 3
Covid, inequality and poverty in 2020 & 2021: How poverty and inequality were reduced in the COVID recession and increased during the recovery. Build Back Fairer series, report no. 3
Read or download the report at: https://bit.ly/3LWJtJn
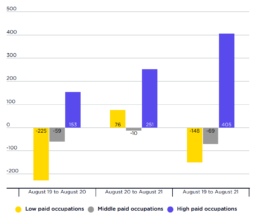
Change in number of workers employed by occupation (000s)
This graph shows that, from August 2020 to August 2021 (centre bars):
* The number of people employed in lower-paid occupations rose by 71,000;
* The number in middle-paid occupations fell by 5,000;
* The number in higher-paid occupations rose by 251,000.
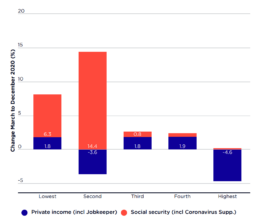
Percentage of people receiving JobKeeper and COVID Supplements by household income groups
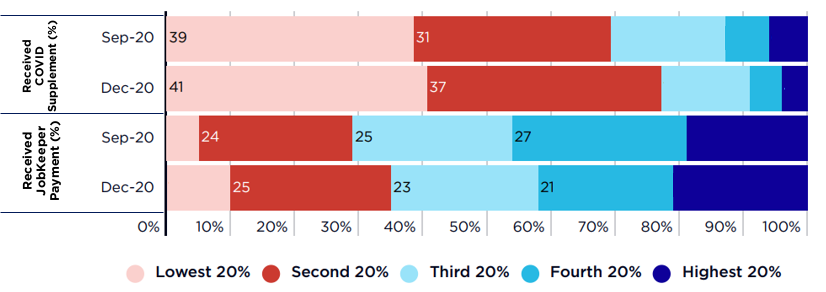
This figure shows shows how COVID income support payments were distributed among households ranked by income in 2020.
JobKeeper Payment mainly lifted the incomes of middle income-households at risk of losing their jobs, and Coronavirus Supplement lifted the incomes of low-income households on income support payments.
Towards the end of the recession in September 2020:
* Around three quarters (76%) of JobKeeper Payments went to the middle 60%;
* A similar proportion of the Coronavirus Supplement (70%) went to the lowest 40%.
* The highest 20% received just 19% of the value of JobKeeper Payment and 6% of that of Coronavirus Supplement.
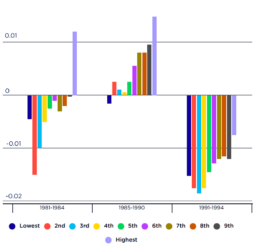
Impact of past recessions on household after-tax incomes
This figure shows changes in household after-tax incomes brought about by the recessions of the early 1980s and 1990s (left and right-hand clusters).
Changes in average before-tax income of households ranked by private income March-December 2020
This graph shows that, from March 2020 to December 2020:
* The average incomes of the lowest 20% income group (who mainly relied on pensions) rose by 8% ($56pw);
* Those of the next 20% (mainly low-paid workers and families on income support) rose by 11% ($144pw);
* The average incomes of the middle 20% rose by 3% ($53pw) and those of the next 20% rose by 2% ($67pw);
* In contrast, the average incomes of the highest 20% fell by 4% ($230pw).
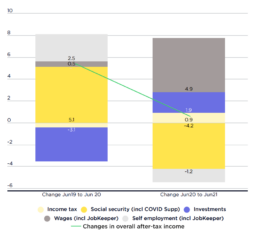
Change in household income (as a % of after-tax income in June 2019)
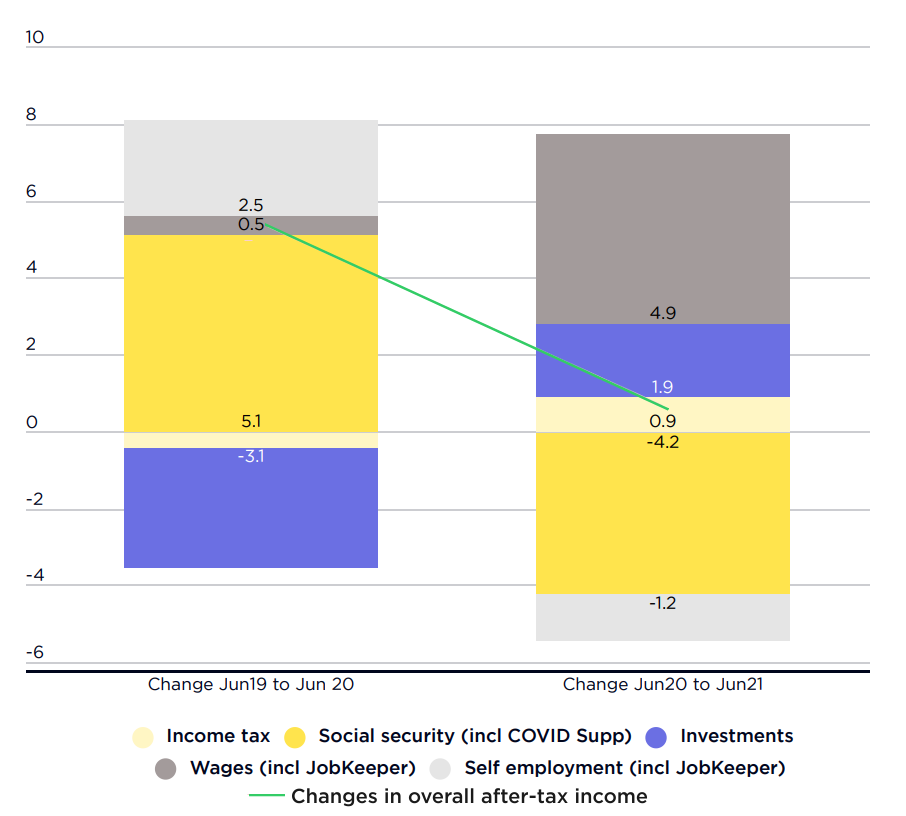
Source: Australian Bureau of Statistics, Australian National Accounts.
Note: Shows growth in different components of household income from June 2019 (before COVID) to June 2020 (recession), and from June 2020 to June 2021 (recovery), as a percentage of average after-tax household income in June 2019. Income tax is expressed in negative values (so a positive value means a reduction in tax). Note that the value of some components fell. Yellow = an increase would be expected to reduce inequality (more so if darker); Blue = an increase would be expected to increase inequality (more so if darker). Grey = an increase has an indeterminant impact on inequality.
This graph compares changes in the main components of household incomes in the financial year of the recession (from June quarter 2019 to June quarter 2020), and the first year of recovery (from June 2020 to June 2021). Changes in the overall value of each income component through each of these years are expressed as a proportion of total household after-tax incomes before the recession in June 2019.
Both the recession and the recovery had large and uneven impacts on different income components. Through the year up to and including the recession (from June 2019 to June 2020 – left column):
* Changes in wages (supported by JobKeeper) increased incomes by 0.5% (in proportion to previous overall after-tax income), earnings from self-employment (also supported by JobKeeper) rose by 2.5%, while investment income fell by 3.1%. Income from social security (including * Coronavirus Supplement) rose by 5.1%, while income tax increases (due to tax ‘bracket creep’) reduced incomes by 0.4%.
Based on the typical distribution of each of these components among income groups, we would expect these changes to reduce income inequality. This is supported by the evidence presented earlier.
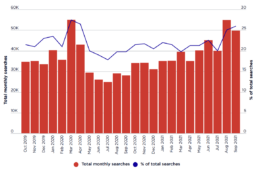
Internet searches for food assistance from October 2019 to September 2021
This graph shows trends in internet searches for food relief from before the COVID recession in October 2019 to September 2021:
It shows similar peaks in searches for food relief at the start of the national lockdown in March 2020 and those in Sydney, Melbourne and Canberra in August 2021, which were experiencing lockdowns at the time.
Significantly, demand fell between March and July 2020 as COVID income supports were introduced, and gradually rose through 2021 after they were removed.