
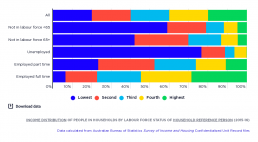
Income distribution of people in households by labour force status of household reference person
[infogram id="_/LQMvqg8oNhPMik0tTILf" prefix="EmC" format="interactive" title="Fig.16_Income distribution of people in households by labour force status of household head (2016)"] This graph shows where people are placed in the household income rankings, according to whether their household reference person (usually the member with the highest income) is employed, unemployed or not in the paid workforce. People in households where the reference person is either not in the labour force or unemployed are concentrated in the lowest 20% income group. Of all people in households where the reference person is unemployed, 77% are in the lowest 20%, along with 59% where the reference person is of working age but outside the paid workforce, and 42% where the reference person is 65 years or over and retired. On the other hand, 29% of people in households where the reference person is employed full-time are in the highest 20%. Living in a household where the reference person is employed…
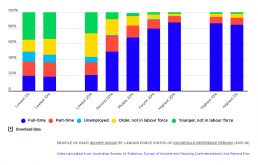
Profile of each income group by labour force status of household reference person
[infogram id="_/6x9dwIyQiXqVCl80hv6K" prefix="MtJ" format="interactive" title="Fig.17_Profile of each income group by labour force status of household head (2016)"] This graph shows the make-up of each income group according to whether their household reference person (usually the member with the highest income) is employed, unemployed or not in the paid workforce. Household members whose reference person is unemployed form a larger share of income groups as we move down the income scale. They represent 7% of the lowest 20% income group; 10% of the lowest 10% income group, and 13% of the lowest 5% income group. This is echoed in households where the reference person is of working age and is not part of the paid workforce, which comprise 28% of the lowest 20% income group, 34% of the lowest 10% income group, and 35% of the lowest 5% income group. The lowest 20% income group mainly comprises households where the reference person is out of the paid workforce: 30% where the reference…
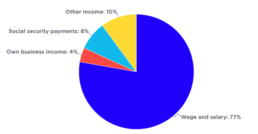
Population by main source of household income
This chart shows the main sources of household income in Australia. [infogram id="_/JqKvaOLmDMkMjRrdiKwW" prefix="5R6" format="interactive" title="Main source of household income 2023"] 2019-20: Wages and salaries were the largest income source (77% of all income), followed by investment and other income (10%), social security payments, including Family Tax Benefits (8%), and own-business income (4%). 2017-18: The main source of household income is wages and salaries, at 75%. Of the remainder, 8% are social security payments, 5% self employed and 12% from other sources (mainly investments). 2015-16: For most people in Australia, the main source of household income is wages and salaries, at 69%. Of the remainder, 18% are in households relying mainly on social security payments, 5% on income from self-employment and 8% from other sources (mainly investments).
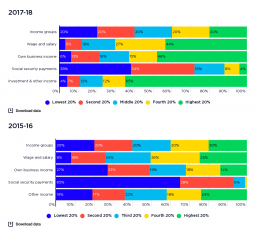
Income distribution of people in households by main income source
This graph shows where people are placed in the household income rankings, according to their household’s main source of income in 2015-16 and 2017-18. Social security payments include pensions, allowances and family payments. [infogram id="_/dDywdtssHktSN7SkXmyn" prefix="P2Z" format="interactive" title="2017-18: Fig.5_Income distribution of people in households by main income source"] 2017-18: The graph shows that the highest 20% income group receives two-thirds of all investment income and a substantial share of own-business income and wages (48% and 44% respectively). At the other end of the scale, the lowest 20% receives over a third of all social security income (38%). 2015-16: The graph shows that 65% of people in households that mainly rely on social security payments are concentrated in the lowest 20% income group. In contrast, people in households relying mainly on wages or salaries are more likely to be found at the higher end of the distribution (with 51% in the highest 40%…
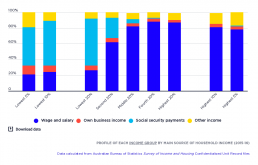
Profile of each income group by main source of household income
[infogram id="_/MacrY6mbHYgL7Gzs3R4H" prefix="tfn" format="interactive" title="Fig.20_Profile of each income group by main source of household income (2016)"] This graph shows the make-up of each income group according to their household’s main source of income. The majority (60%) of people in the lowest 20% income group live in households where the main income is social security payments. However, 40% of people in that income group live in households relying mainly on other income sources, including wages (26%), own business income (6%) and ‘other income’, mainly investments (8%). Towards the higher end of the income scale, 87% of those in the highest 20% income group are in households relying mainly on earnings, and none are in households relying mainly on social security. However, even higher up the scale an increasing share of people live in households rely mainly on investment income – from 9% of the highest 20% income group, to 14% of the highest 10% income group, and 17% of…
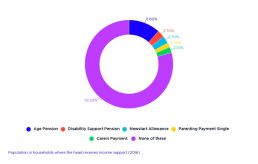
Population in households where the head receives income support (2016)
[infogram id="_/VUfd6ipGsl04uAr5VN4c" prefix="k7i" format="interactive" title="Fig.21_Population in households where the head receives income support (2016)"]
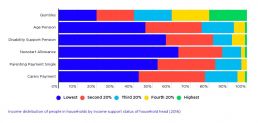
Income distribution of people in households by income support status of household head (2016)
[infogram id="_/5sZocYMRvR4f3rszzi34" prefix="m66" format="interactive" title="Fig.22_Income distribution of people in households by income support status of household head (2016)"]
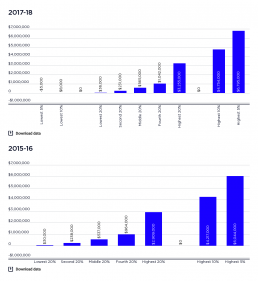
Average net wealth, by wealth group
This graph shows the distribution of wealth by wealth groups. Wealth is distributed much less broadly than income [infogram id="_/SaIauon5cFaRQA9c0tde" prefix="3Ef" format="interactive" title="2017-18: Fig.12_Average net wealth, by wealth group (2016)"] 2017-18: The average wealth of the highest 20% wealth group is $3,255,000, more than six times that of the middle 20% who had $565,000; and over 90 times that of the lowest 20%, who had $36,000. The average wealth of the highest 5% is $6,795,000. 2015-16: The highest 20% wealth group had average wealth holdings of $2.9 million, more than five times that of the middle 20% wealth group ($537,000) and almost 100 times the $30,000 held by the lowest 20% wealth group.
Trends in average wealth by wealth group
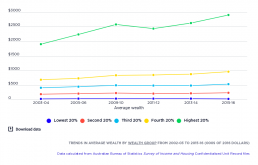
[infogram id="_/NpwEhneeujvD0f50Gzwi" prefix="s5o" format="interactive" title="2023_Trends in average wealth by wealth group from 2002-03 to 2022-23"] This shows changes in the 'real value' (after inflation) of net household wealth. From 2003 to 2022, the highest 20% of households by wealth left the other 80% behind This chart shows that the average wealth of the highest 20% rose sharply after inflation from $1,996,000 in 2003 to $3,632,000 in 2022 while growth in wealth for the rest of the population was more modest. The average wealth of the middle 20% rose from $428,000 to $689,000, while that of the lowest 20% rose from $35,000 to $42,000.
Shares of national wealth by wealth group
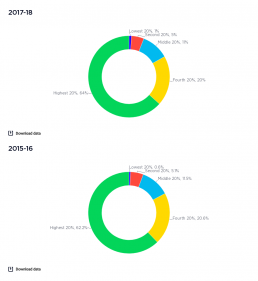
This graph shows how wealth is divided up among households. This probably underestimates of the true extent of wealth inequality. The wealthiest 1%, who own a disproportionate share of all wealth, are a small number of people and so are underrepresented in household surveys. It is also likely that many under-report their wealth. See the pie chart showing shares of income by income group. [infogram id="_/65ST6ouC4exyuNl9aBxk" prefix="q0E" format="interactive" title="2017-18: Fig.13_Shares of national wealth by wealth group"] 2017-18: The wealthiest 20% holds 64% of all wealth, followed by 20% for the next wealthiest group. The remaining 60% of households have just 17% of wealth between them. 2015-16: The highest 20% of household wealth groups holds 62% of all wealth. The middle 20% wealth group holds 12%, and the lowest 20% wealth group holds less than 1%. Wealth is highly concentrated at the very top. The highest 10% wealth group owns 45% of all wealth while the highest 5% owns 32%…