

New research shows ‘pernicious effects’ of removal of Coronavirus Supplement
A new report from the Poverty and Inequality Partnership led by ACOSS and UNSW Sydney has found that while the Coronavirus Supplement introduced in 2020 gave recipients the breathing space to afford basics such as food and medication, its removal had a pernicious effect that hit hard. Australian experiences of poverty: risk precarity & uncertainty during COVID-19 found the extra $275 a week from April 2020 was critically important to improving wellbeing during the pandemic. The qualitative research study, based on phone interviews with 33 income support recipients, revealed the payment provided a reprieve from ongoing financial stresses and allowed recipients to plan for their future for the first time. But when the supplement was first reduced from September 2020 and then abolished in April 2021, participants were forced to return to acute financial stress and experienced increased feelings of exclusion. Report authors Professor kylie valentine, Dr Yuvisthi Naidoo and Dr…


Poverty gaps
This graph shows the average poverty gap for all households in poverty from 1999 to 2019. It is in 2019 dollars, and using the 50% median income after-housing costs poverty line.
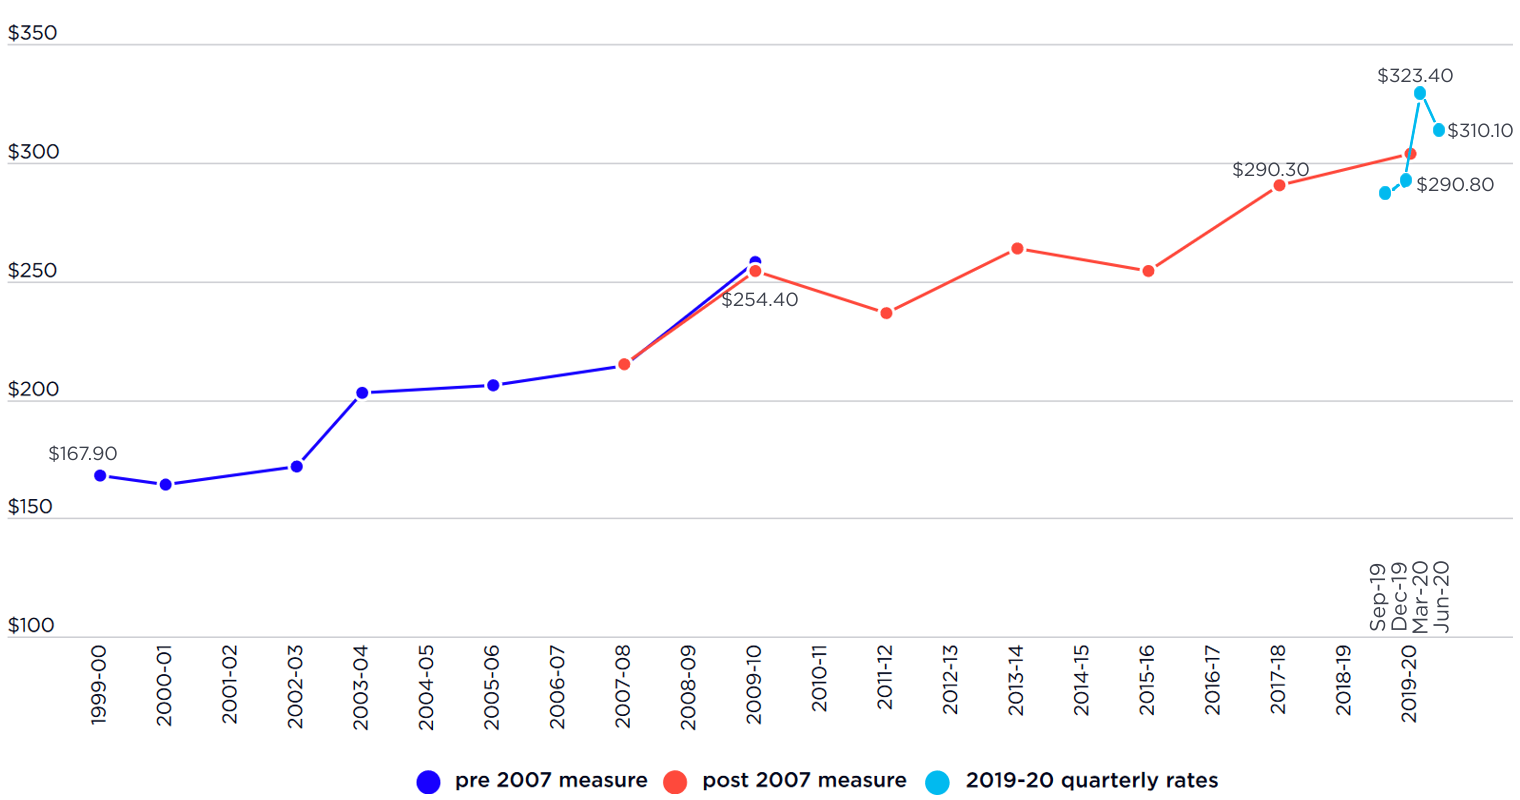 The higher (red) line shows poverty gaps measured using the pre-2007 ABS income definition, while the lower (dark blue) line is based on the post 2007 income definition. The light blue line shows the quarterly changes in the poverty gap during the 2019-20 period.
The average poverty gap increased steadily from $168 per week in 1999 to $254 per week in 2009 (in constant 2019 values), then rose to $290 per week in 2017. Over that period the poverty gap followed a different pattern to the poverty rates during the same period, reflecting a combination of factors working against each other:
* Changes in…
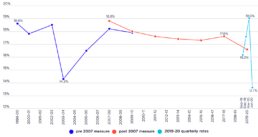
Percentage of children in poverty from 1999-2019
This graph shows the percentage of children in poverty from 1999 - 2019, using the 50% of median income after-housing costs poverty line.
The poverty line used is 50% of median income, taking account of housing costs. The lower (dark blue) line shows poverty rates measured using the pre-2007 ABS income definition, while the higher (red) line is based on the post 2007 income definition. The light blue line shows the quarterly changes in poverty rates during the 2019-20 period.
It shows that child poverty, alongside the overall poverty rates, declined substantially from 1999 to 2003 (from 18.6% to 14.3%), then rose to 18.8% in 2007. It fell gradually to 17.6% in 2017.
It also shows that child poverty rose sharply than fell dramatically during the first year of the pandemic (2019-20); from 16.2% in the September quarter of 2019 to 19% in the March quarter of 2020, then fell to 13.7%, a two-decade low, in June 2020.
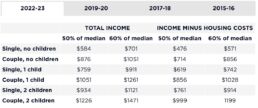
Poverty lines by family type
This table shows poverty lines by family type in dollars per week, including social security payments. This shows relative poverty in Australia using poverty lines of 50% and 60% of national median household income. More information on the definitions of poverty and different ways of measuring poverty can be found on our poverty page and our FAQ page. It also shows the poverty lines before and after housing costs are taken into account (known as before and after housing costs; or as total income and income minus housing costs). Housing costs vary considerably among households, depending on whether those households are owners, purchasers or tenants and what part of Australia those households live in. In order to take into account the varying costs of housing, a separate set of ‘after housing costs’ (or 'income minus housing costs') poverty lines is used. This set is created by removing housing costs from disposable income before calculating the median income. This is a measure of the…
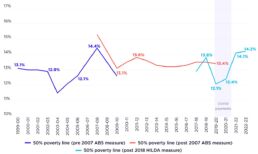
Percentage of all people in poverty from 1999 - 2023
This figure shows the percentage of all people in poverty from 1999-00 to 2022-23. It shows how the rate of poverty declined from 13.4% in 2017-19 to 12.1% in 2019-20, then rose to 12.4% in 2020-21, and even further to 14.1% in 2021-22. The poverty line used is 50% of median income, taking account of housing costs. The lower (dark blue) line shows poverty rates measured using the pre-2007 ABS income definition, while the higher (red) line is based on the post 2007 income definition; the data shown is from the ABS Survey of Income and Housing. The light blue line shows poverty as measured using the Household Income and Labour Dynamics in Australia (HILDA) survey from the Melbourne Institute.'
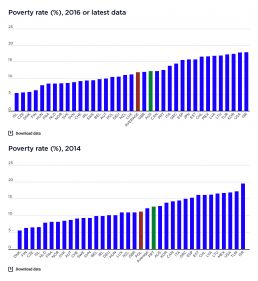
Poverty rates in OECD countries
[infogram id="_/Xd48aJpgkLnpVZZcd60A" prefix="8ng" format="interactive" title="Copy: Poverty rates in OECD countries in 2016 (% of people)"] Although the Organisation for Economic and Social Development (OECD) uses the 50% median income poverty line, differences in research methodology mean that the results are close to but not identical to those reported in this website for Australia. 2021 or latest data This graph shows poverty rates among the Organisation for Economic and Social Development (OECD) countries in 2021 (or latest data), using the 50% median income poverty line. The OECD’s estimate for the overall rate of poverty in Australia according to this graph is 12.6% (compared with our estimate for 2019-20 of 13.4%). This makes Australia’s poverty rate the 15th highest among the 38 OECD countries. 2017-18 This graph shows poverty rates among the Organisation for Economic and Social Development (OECD) countries in 2016, using the 50% median income poverty line. The OECD’s…

Average wealth per adult in 2020
[infogram id="_/mIjUrZvfD3DxGdqIblfo" prefix="qwb" format="interactive" title="Average wealth per adult in 2020 ($AUS)"] According to Credit Suisse’s Global Wealth Report, the average wealth of Australian households was $628,000 per adult in 2020, the fourth highest in the world behind Switzerland, the United States and Hong Kong (North America as shown on the graph refers to the region, as does Asia-Pacific and Europe).