Covid, inequality and poverty in 2020 & 2021: Build back fairer report no. 3
This report is the third in the ACOSS and UNSW Sydney Poverty and Inequality Partnership’s COVID-19 Build Back Fairer Series. It tells a tale of the differing impacts of the pandemic for different groups using evidence on income inequality and poverty in Australia.
The purpose of the Build Back Fairer Series is to help us understand the effects of COVID policy responses on different population groups, with a focus on different income groups and the experience of people relying on income support payments. The series draws together data on the impacts of the COVID recession on income support, employment, inequality, wealth and regions.
The first report in the Build Back Fairer Series, Analysis of income support in the COVID lockdowns in 2020-21 analysed the changes to income support arrangements for people in different locations across Australia during the COVID pandemic. The second report of the series, Australian income support since 2000: Those left behind shows the people who have been impacted most by changes to income support payments over the past 20 years, both negatively and positively.
We trust this report will assist decision-makers to design policy responses to build back fairer in a manner that includes people hit hardest by the effects of the COVID pandemic, including those on the lowest incomes.
The Poverty and Inequality Partnership between ACOSS and UNSW Sydney explores the ways in which inequality and poverty relate to measures of disadvantage such as health, housing and homelessness through the inclusion of researchers from multiple disciplines.
We extend our sincere gratitude to the ACOSS members and philanthropists who continue to support this vital research partnership, including Anglicare Australia; Australian Red Cross; the Australian Communities Foundation Impact Fund (and three subfunds – Hart Line, Raettvisa and the David Morawetz Social Justice Fund); the BB and A Miller Foundation; the Brotherhood of St Laurence; cohealth, a Victorian community health service; the David Morawetz Social Justice Fund; Good Shepherd Australia New Zealand; Mission Australia; the St Vincent de Paul Society; the Salvation Army; and The Smith Family.

Cassandra Goldie & Carla Treloar
Key findings
This report summarises evidence on the impact of the COVID recession and recovery on income inequality and poverty in Australia, including new ABS data tracking inequality during 2020 and 2021. The data tell a tale of two very different pandemic experiences:
- In 2020, income inequality and poverty declined during the ‘Alpha’ wave of the pandemic despite the deepest recession in a century and an ‘effective unemployment rate’ reaching 17%, due to robust public income supports – JobKeeper Payment and Coronavirus Supplement.
- In the first half of 2021, employment and earnings recovered but these income supports were withdrawn. The available evidence indicates that income inequality and poverty increased above pre-pandemic levels.
- In September 2021, with half the population back under lockdown in response to the ‘Delta’ wave of the pandemic, the effective unemployment rate was 9%.
- COVID income supports in response to the Delta wave were much weaker, as over 80% of people on the lowest income support payments were excluded from the COVID Disaster payment. Those payments have now been phased out.
- The legacy of the two pandemic experiences is likely to be higher inequality and poverty than beforehand, despite remarkable progress in reducing both in 2020. By September 2021 there were 1.7 million people on the lowest income support payments (25% more than before the pandemic) and those payments still sit below the poverty line.
1. Changes in income inequality
In 2020, despite the recession, income inequality declined
In the June quarter of 2020, Gross Domestic Product (GDP) fell by 7.0 per cent, the largest quarterly fall on record, and unemployment rose from 5.1% to 17%.1The effective unemployment rate is a measure used by Treasury to take account of the unusually large numbers of people either stood down from their jobs but still employed, or leaving the paid workforce (see Attachment). The recovery began in the September quarter but at the end of 2020, the effective unemployment rate was 7% and employment had not yet recovered to its pre-recession level. Despite this, the average incomes of the lowest 80% of households by income rose from March to December 2020.
When we divide all households into five equal groups ranked by their private incomes (earnings and investment income before tax), average before-tax incomes (including social security) rose more for the lowest 40% than for people with higher incomes, that is, income inequality declined.
Between March and December 2020:
- The average incomes of the lowest 20% income group rose by 8% ($56pw) and those of the next 20%) rose by 11% ($144pw).
- The average incomes of the middle 20% rose by 3% ($53pw) and those of the next 20% rose by 2% ($67pw).
- In contrast, the average incomes of the highest 20% fell by 4% ($230pw).2Australian Bureau of Statistics (2021), Household Financial Resources, June to December 2020.
The Coronavirus supplement and JobKeeper payment played a decisive role
The income support safety net for the lowest 40% of households by private income was strengthened by the Coronavirus Supplement and one-off payments, and increased receipt of Jobseeker payments:
- 70% of those receiving the Coronavirus Supplement were in the lowest 40% of households;
- From March to December 2020, average social security payments received rose by $43pw for the lowest 20% and $194pw for the next 20%.3Australian Bureau of Statistics (2021), Household Financial Resources, June to December 2020. This average increase includes people not receiving income support, so the increase is partly due to higher payments (the Coronavirus Supplement) and partly to larger numbers of people on income support as unemployment rose.
- Income support for the middle 60% of households by income, many of whom were people stood down without pay, was provided through the JobKeeper payment, a wage subsidy that also kept them connected with their employment;
- Around 70% of those receiving JobKeeper payment belonged to the middle 60%;
- From March to December 2020, their average private incomes (including JobKeeper, which was paid as wages) rose slightly (by $13pw) despite many being stood down from their jobs.
Those in the highest 20% were less affected by loss of paid working hours and received less income support:
- Just 6% of people on the Coronavirus Supplement belonged to this group.
- While close to 20% of those on JobKeeper Payment were in this group, as a flat-rate payment it was worth less to them in relation to their previous wage.
- The average private incomes of households in this group fell by $239pw and their average income from social security (small to begin with) rose by only $8pw.4Australian Bureau of Statistics (2021), Household Financial Resources, June to December 2020.
It is likely that income inequality increased in the economic recovery as income supports wound back
By June 2021, employment and Gross Domestic Product had returned to pre-recession levels before another round of COVID19 lockdowns later in the year.
We lack detailed data on changes in the distribution of household incomes in 2021, but we do have information on growth in the different components of income through the financial years 2019-20 (including the recession) and 2020-21 (during the economic recovery).
Through 2019-20 and despite the recession, overall after-tax household incomes rose including:
- a 0.5% increase from wages and a 2.5% increase from self-employment earnings (both supported by JobKeeper Payment), which generally benefitted middle-income households;
- offset by a 3.1% reduction from a decline in investment income and 0.4% reduction from higher income tax payments, both of which mainly impacted high-income households; and
- a 5.1% increase from social security income (including Coronavirus Supplement), which generally benefitted low-income households.5Australian Bureau of Statistics (2021), Australian National Accounts. We calculate the rise or fall of different components of income as a percentage of overall after-tax income before the pandemic in June 2019, in order to take account of the relative weight of different income components in overall household incomes as well as changes in the value of each component. For example, earnings from employment comprise three quarters of all household income while the other components are much smaller.
This is consistent with the above evidence that increased public income support in the recession reduced income inequality by more than offsetting the inequality-inducing impact of a fall in employment.
The reverse occurred in the first year of recovery (2020-21). That is, the removal of income supports (which mainly go to people with low incomes) between June 2020 and June 2021, together with strong growth in investment incomes (which mainly go to those with high overall incomes) is likely to have more than offset the equalising effect of the recovery in employment.6This provisional assessment does not take account of changes in the distribution of incomes within each of these components. For example, if many people moved from unemployment to fulltime employment, this would reduce inequality despite the reduction in overall social security income. However, in a separate analysis we find that overall growth in employment in the recovery was dominated by highly paid (managerial and professional) occupations which increased by 251,000, while entry level employment grew by just 71,000 and middle-income jobs declined.
Through 2020-21, overall after-tax household incomes rose through the combined effect of:
- a 4.9% increase in earnings from wages partly offset by a 1.2% fall in earnings from self-employment (as paid working hours increased, partly offset by the removal of JobKeeper);
- a 1.9% increase from higher investment incomes (as financial markets recovered strongly);
- a 0.9% increase due to income tax cuts;
- a 4.2% reduction from a decline in social security income (as Coronavirus Supplement was removed and the number of people on income support declined).
Further, growth in employment between August 2020 and August 2021 skewed towards higher-paid positions, likely increasing inequality. Higher-paid jobs grew by three times more than low-paid positions while middle-level jobs declined.
2. Changes in poverty and financial stress
In 2020, the Coronavirus Supplement helped reduce poverty by half
Poverty typically increases in recessions but this one was different. At its highest level in June 2020 ($275pw), the Coronavirus Supplement lifted incomes for single people on JobSeeker payments (with Rent Assistance) to $634pw, an estimated $154pw above the 50% of median income poverty line. Together with JobKeeper Payment, which kept many people employed, this dramatically reduced poverty despite the recession:
- An estimated 2,613,000 people were in poverty in June 2020, much less than the 3,018,000 in 2019, and half the number that would have been in poverty (5,772,000) in June 2020 had the COVID income supports not been introduced.
- In June 2020, 9.9% of people were below the poverty line, compared with 11.8% in 2019 and 22.7% who would have been in poverty in June 2020 without the new income supports.7Philips B et al (2020), COVID-19, JobKeeper and JobSeeker impacts on poverty and housing stress under current and alternative economic and policy scenarios. ANU Centre for Social research and Methods and unpublished data on after-housing poverty rates provided by the authors. The poverty line is 50% of median equivalent household disposable income and housing costs are taken into account. Note that the pre-COVID poverty estimates here are lower than others since the lowest 2% of households by income were removed from the sample for modelling purposes (on the grounds that reported incomes for this group are not always accurate).
The Coronavirus Supplement reduced poverty sharply among people on income support:
- Poverty among people in households on JobSeeker Payment fell by four-fifths, from 76% in 2019 to 15% in June 2020;
- Poverty among people in sole parent families (both adults and children) was reduced by almost half, from 34% to 19%.8Philips B et al (2020), COVID-19, JobKeeper and JobSeeker impacts on poverty and housing stress under current and alternative economic and policy scenarios. ANU Centre for Social research and Methods. Unpublished data on poverty rates was also provided by the authors.
These reductions in poverty were partly reversed after the Supplement was reduced to $125pw from September to December 2020:
- Poverty among people in households on Jobseeker Payment rose to 48%;
- Poverty among people in sole parent families rose to 31%.
In 2020, improved income support eased financial stress for people on the lowest incomes
Fewer people on income support experienced severe financial stress after the Coronavirus Supplement and JobKeeper Payments were introduced. Between March and December 2020:
- The proportion of people mainly reliant on social security in severe financial stress (three or more stress indicators) fell from 23% to 18%.
- The proportion who regularly had trouble paying household bills fell from 15% to 9%.
- The proportion who relied on emergency relief agencies fell from 14% to 9%.9Australian Bureau of Statistics 2021, Household Financial Resources, June to December 2020.
Progress in reducing poverty was reversed in the first half of 2021 as COVID income supports were wound back
Poverty rose to well above pre-recession levels when the Coronavirus Supplement was cut to $75pw in January 2021:
- The income of a single adult on JobSeeker Payment was approximately 15% below the poverty line.
The number of people in poverty was estimated to rise to 3,820,000 (14% of all people), compared with 3,018,000 (11.5%) before the pandemic.10Philips B et al (2020), Op. Cit. and author’s calculations. Despite an ongoing $25pw increase in the lowest income support payments, it is likely that poverty increased further in April 2021 after the Supplement was removed:
- The new single rate of JobSeeker payment was approximately 30% below the poverty line.
- Among people on JobSeeker Payment, 33% reported greater difficulty paying for essentials after to the ending of the Coronavirus Supplement.11Deloitte (2021), Energy consumer research insights.
From August 2021, half the country was again under lockdown but with a weaker safety net
In July 2021, the Delta variant of COVID-19 swept across the country. By August, lockdowns were reimposed on half the Australian population (in New South Wales, Victoria and the Australian Capital Territory). From May to September 2021, employment fell by 2% and paid working hours fell by 5%. The ‘effective unemployment rate’, which takes account of people working zero hours and those who left the labour force, rose to 9% – a similar level to that at the end of the recession in September 2020 (10%).12ACOSS (2021), Faces of unemployment. 2021
In September 2021, JobSeeker Payment for a single adult (plus Rent Assistance) was $391pw – approximately 30% below the poverty line – and only one in four (26%) people on that payment had additional income from employment. Youth Allowance was even lower at $331pw.
In August 2021, the government introduced a COVID-19 Disaster Payment as the successor to the former JobKeeper Payment and Coronavirus Supplement. The Disaster payment was more narrowly targeted:
- People losing at least 8 hours paid work a week in a current lockdown received $750pw if they lost at least 20 hours per week, or $450pw if they lost 8 to 20 hours a week.
- People on income support payments such as Jobseeker Payment received a $200pw supplement, but only if they lost at least 8 paid hours of work a week.
- Those already unemployed before the latest lockdown were mostly excluded even though they were also disadvantaged by the loss of job opportunities.
In September 2021, of the 927,000 people under lockdown on the lowest income support payments (which formerly attracted the Coronavirus Supplement), just 162,000 (17%) received the $200pw COVID-19 Disaster Payment. Most of the remaining 765,000 (together with another 735,000 people on the lowest income support payments outside the locked-down states) were likely to be living in poverty.
From July to August 2021, reliance on welfare agencies for emergency relief rose sharply
Data from online search activity and welfare agencies indicates that financial hardship increased in states affected by lockdowns in July and August 2021.13ACOSS (2021), Financial distress in lockdown.
In the two-week lockdown commencing in Melbourne at the end of June (and later reimposed):
- Internet searches for financial assistance rose by almost 50%
In the Sydney lockdowns that commenced at the end of June and continued through August:
- Internet searches for financial assistance rose by 100% between 30 June and 14 July.
- Foodbank Australia increased the amount of food provided to individuals and welfare agencies by around 40% between late June and early August.
COVID-19 Disaster Payments were phased out at the end of 2021, leaving many on poverty-level unemployment payments
The government announced in September 2021 that COVID-19 Disaster Payments will be phased out two weeks after any state reaches the National Cabinet’s 80% vaccination target, regardless of any remaining COVID restrictions and unemployment levels. At that time there were 1.9 million people on those payments. COVID Disaster Payments were likely to be phased out by the end of 2021.
Many people on COVID-19 Disaster Payments transferred to JobSeeker Payment or Youth Allowance. Their incomes typically fell from $750pw (if previously employed fulltime) or $450pw (if previously employed part time) to just $391pw (on Jobseeker Payment) or $331pw (on Youth Allowance).
Many joined the ranks of the 1,662,000 people on the lowest income support payments (around 25% more than before the pandemic in September 2019) living in poverty.14ACOSS & UNSW Sydney (2021), COVID income support – Build back fairer, report 1. This refers to the payments that attracted the Coronavirus Supplement and includes Parenting Payment as well as Jobseeker Payment and Youth Allowance.
This report is part of a series on poverty and inequality in Australia produced by a partnership between the Australian Council of Social Service (ACOSS) and University of New South Wales (UNSW) Sydney.
Previous reports have used the biennial Australian Bureau of Statistics (ABS) Income and Housing Surveys to measure the extent of income and wealth inequality and poverty, examine their main causes and groups impacted, and to track trends in inequality and poverty.
The COVID recession and public policy responses in Australia since 2020 have dramatically impacted household incomes and wealth. Large shifts in incomes and wealth that would normally take decades to play out have been compressed into the last two years.
The results of comprehensive surveys of the distribution of incomes and wealth such as the ABS Income and Housing survey are not yet available. Yet there is enough evidence from other ABS surveys, academic research and data from public and non-government service providers to draw preliminary conclusions about the impacts on inequality of:
- The loss of private incomes and wealth from the recession in the June and September quarters of 2020 and the extent to which its impact on inequality and poverty was offset by public policies, especially new public income supports;
- The recovery of private incomes and phased withdrawal of income supports as ‘COVID19 lockdowns’ were eased later that year;
- A new round of lockdowns in mid 2021 accompanied by a new set of public income supports.
This report pulls together evidence of the impacts of these developments on income inequality and poverty. A subsequent report will examine the impact on wealth inequality. An attachment summarises the main economic and policy changes that shaped the recession and recovery.
These are companion reports to the more comprehensive analysis provided by the principal reports from the partnership:
- Davidson, P., Bradbury, B., Hill, T. and Wong, M. (2020), Poverty in Australia 2020: Part 1, Overview ACOSS/UNSW Poverty and Inequality Partnership Report
- Davidson, P., Bradbury, B., and Wong, M. (2020), Poverty in Australia 2020: Part 2, Who is affected? ACOSS/UNSW Poverty and Inequality Partnership Report
- Davidson P; Bradbury B; Wong M & B; Hill T (2020), Inequality in Australia 2020: Part 1: Overview. ACOSS/UNSW Poverty and Inequality Partnership Report
- Davidson P; Bradbury B; Wong M & B; Hill T (2020), Inequality in Australia 2020: Part 2, Who is affected and why ACOSS/UNSW Poverty and Inequality Partnership Report
And are part of the Build Back Fairer series of reports produced during the pandemic by the partnership:
- Davidson, P., Bradbury, B., Dorsch, P. (2021), COVID income support: Analysis of income support in the COVID lockdowns in 2020 and 2021. ACOSS/UNSW Sydney Poverty and Inequality Partnership, Build Back Fairer Series, Report No. 1,
- Bradbury, B and Hill, P (2021), Australian income support since 2000: Those left behind ACOSS/UNSW Sydney Poverty and Inequality Partnership, Build Back Fairer Series, Report No. 2
In part one we scan the available evidence on how the incomes of households at different levels on the income scale changed through 2020 and 2021 and draw preliminary conclusions as to whether income inequality rose or fell.
1.1 Income inequality in the COVID recession (2020)
We rely here on data from the ABS Survey of Household Financial Resources, which draws on early results from the Survey of Income and Housing and shows broad trends in the distribution of incomes from March 2020 through to December 2020.15 Australian Bureau of Statistics (ABS) (2021), Household Financial Resources, June to December 2020. Other researchers examined the impact of the COVID recession on income inequality. Using microsimulation methods, Li et al (2020) found that average after-tax incomes in all household equivalised disposable income quintiles rose and that the lowest 20% had the highest increase (4.8%). Without COVID income supports, all income groups would have lost income. (Li J et al 2020, The impact of COVID19 and policy responses on Australian income distribution and poverty. NATSEM, University of Canberra). Using a monthly population survey, Biddle et al (2020) found that average after-tax incomes of the lowest 40% of individuals ranked by income increased, with the largest change (over 50%) in the lowest decile (presumably people on working age income support). (Biddle N et al 2020, Tracking outcomes during the COVID-19 pandemic (August 2020). ANU Centre for Social Research and Methods).
In 2020, despite the recession, income inequality declined
Figure 1 shows trends in before-tax incomes for households ranked by private income from March 2020 (just before the recession) to June 2020 (when Australia was locked-down and effective unemployment reached 17%) and December 2020 (when most lockdowns had eased and effective unemployment had declined to 7%).16ABS (2021), ibid The social security payments referred to here are average payments received by each income group, including those who did not receive income support. Due to data limitations, households were ranked according to their pre-COVID private income (such as wages and investment income), there was no adjustment for household size, and income tax was not modelled. The composition of these income groups is therefore different to that in previous ABS and ACOSS-UNSW publications on inequality (ACOSS & UNSW Sydney 2020, Inequality in Australia – Overview). Note that JobKeeper was paid through employers so the ABS includes it in private income. A separate ABS report divided households into five groups ranked by after-tax incomes including social security and compared their average after-tax incomes between 2017-18 and 2019-20. Incomes rose by 4.4% for the lowest 20%, 4.1% for the second 20%, 3.9% for the middle 20%, 1.8% for the next 20%, and fell by 0.3% for the highest 20% (ABS 2021, Australian National Accounts: Distribution of Household Income, Consumption and Wealth).
From March to December 2020, average before tax incomes:
- Rose from $685pw to $741pw for the lowest 20% of households ranked by income;
- Rose from $2,005pw to $2,058pw for the middle 20%;
- Fell from $5,182 pw to $4,952pw for the highest 20%.
These figures indicate that income inequality declined despite the recession, an extraordinary result given past experience (discussed below).
Figure 1: Average before-tax household income ($pw)
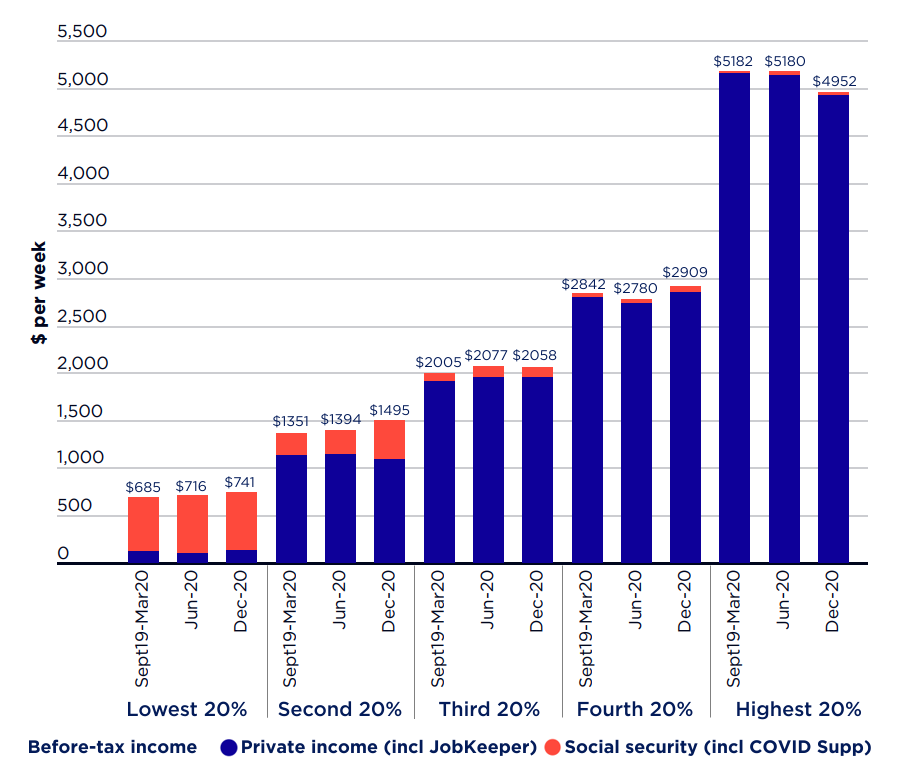
Source: Australian Bureau of Statistics (2021), Household Financial Resources, June to December 2020
Note: Households are ranked by equivalised private income. Private income includes wages and investment income and JobKeeper Payment. Social security includes pensions, Jobseeker Payment and Coronavirus Supplement. The lowest 40% are likely to mainly consist of people on income support payments or low wages. The highest 20% is likely to mainly consist of two-income households.
Sept19 to Mar20 = pre recession (no COVID income supports)
Jun20 = recession (max COVID income supports)
Dec20 = early stage of recovery (lower COVID income supports)
Figure 2 shows that from March 2020 to December 2020:
- The average incomes of the lowest 20% income group (who mainly relied on pensions) rose by 8% ($56pw);
- Those of the next 20% (mainly low-paid workers and families on income support) rose by 11% ($144pw);
- The average incomes of the middle 20% rose by 3% ($53pw) and those of the next 20% rose by 2% ($67pw);
- In contrast, the average incomes of the highest 20% fell by 4% ($230pw).
Figure 2: Changes in average before-tax income of households ranked by private income March-Dec 2020 (% of before-tax income in March 2020)
The large increases in income from social security received by the lowest and second 20% income groups (6% and 14% respectively) provide a clue as to the main reason this recession did not increase income inequality. People of working age on the lowest incomes were shielded from income losses by a combination of the Coronavirus Supplement and one-off lump sum payments.
The increases of around 2% in the private incomes (mostly wages) of the third and fourth 20% in the midst of a recession are largely due to the JobKeeper Payment, which was paid as a wage subsidy to employers and passed on in workers’ pay packets.
Those in the highest 20% of households by income were not as well protected from income losses by these COVID income supports, since they were paid at flat fortnightly rates (not a proportion of previous wages) and the Coronavirus Supplement was income-tested.17Australian Treasury (2021), Insights from the first six months of Jobkeeper Those in the highest 20% of households by income were also disproportionately affected by a decline in investment income due to the impact of the recession on dividend and interest payments.18 The main causes of the decline in investment income were a sharp fall in share values in the March quarter of 2020, a related decline in dividend payments, and lower interest payments on savings accounts.
This is a far better outcome for people with low incomes than in past recessions
Figure 3 shows changes in household after-tax incomes brought about by the recessions of the early 1980s and 1990s (left and right-hand clusters). If we compare figures 2 and 3, it is clear that the financial impact of the 2020 recession for people in the lower half of the income distribution was less severe than in the past.19In the recession of the early 1990s, the Gini coefficient for annual family disposable income (a measure of inequality where complete equality of incomes has a value of zero and complete inequality a value of 1) rose from 0.279 in 1990 to 0.301 in 1994, mainly due to sharp falls in the average incomes of the lowest 50% of families ranked by income. See Johnson D & Wilkins R (1996) The causes of changes in the distribution of family income in Australia, 1982 to 1997–98, Department of Families, Community Services and Indigenous Affairs Social Policy Research Paper No 27; and Whiteford P (2018), Good times, bad times, and the growing income gap, Inside Story, 5 July 2018.
Figure 3: Impact of past recessions on household after-tax incomes (% change over each period)
The Coronavirus Supplement and JobKeeper payment played a decisive role
To support people in a nation-wide lockdown, the government increased spending on income support by over $50 billion (equivalent to 15% of all household income) in the June quarter 2020 alone. In August 2020:
- 3.6 million people received a $750pw JobKeeper Payment for workers in businesses with substantially reduced turnover;
- 2.2 million people on the lowest income support payments (including Jobseeker Payment, Youth Allowance and Parenting Payment) received a $275pw Coronavirus Supplement, whether or not they lost employment in the lockdowns (see Attachment for more detail).
Figure 4 shows how these COVID income support payments were distributed among households ranked by income. JobKeeper Payment mainly lifted the incomes of middle income-households at risk of losing their jobs, and Coronavirus Supplement lifted the incomes of low-income households on income support payments. Towards the end of the recession in September 2020:
- Around three quarters (76%) of JobKeeper Payments went to the middle 60%;
- A similar proportion of the Coronavirus Supplement (70%) went to the lowest 40%.
- The highest 20% received just 19% of the value of JobKeeper Payment and 6% of that of Coronavirus Supplement.
Figure 4: Percentage of people receiving Jobkeeper and COVID Supplements by household income group (% of all recipients)
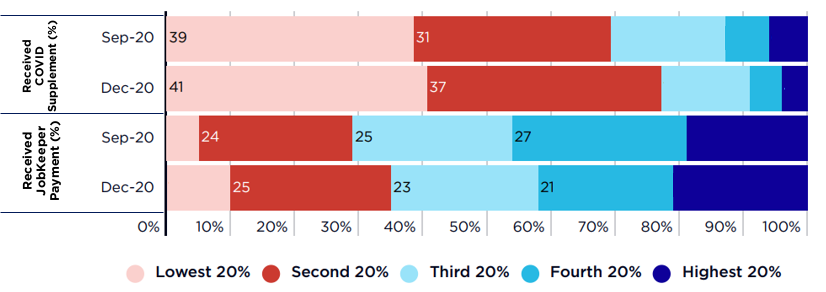
ABS (2021), Household Financial Resources, June to December 2020.
Note: Households ranked by private income in March 2020
1.2 The main drivers of income inequality: household incomes in recession and recovery (2019-20 to 2020-21)
We lack recent data on the distribution of household incomes in the recovery from recession beyond December 2020. In this preliminary assessment of the impact of recession and recovery on income inequality, we infer this from trends in the overall value of different income components (such as wages and social security) and trends in employment by occupation.
During the trough of the recession (in the June quarter 2020), income losses from paid work were cushioned by public income supports which mainly went to low and middle-income households. This reduced inequality, as we have seen.
Then from September 2020 to April 2021, JobKeeper Payment and Coronavirus Supplement were reduced and then withdrawn (see Attachment for details). All things equal, this would have increased income inequality. Whether that occurred depends on the speed of the recovery in earnings from employment and investment incomes, and how the resulting increase in private income was distributed among household income groups.
Of the main income components, social security skews towards low-income households, investment income to high-income households, and earnings from employment to middle-income households.
Figure 5 compares the degree to which each income component is skewed towards higher- or lower-income households. In 2017-18, before the recession:
- 65% of investment income went to the highest 20% income group, who paid 58% of personal income tax;
- 89% of labour earnings and 79% of self-employment earnings went to the highest 60%.
- 72% of social security payments went to the lowest 40% of households by income.20Davidson P; Bradbury B; Wong M & B; Hill T (2020), Inequality in Australia Part 1: Overview. ACOSS/UNSW Poverty and Inequality Partnership Report.. One measure of the extent to which an income source is skewed towards higher-income households is the Concentration Index. This ranges from -0.1 where income is concentrated in the lowest income group to 0 where it is equally distributed and 1.0 where it is all received by the highest income group. The values for this Index in 2017-18 were: 0.58 for income tax, 0.56 for investment income, 0.44 for wages and salaries, 0.39 for self-employment earnings, and -0.41 for social security payments.
Figure 5: Distribution of income by source (% of all income in 2017)
Generally, increases in investment incomes and income tax cuts increase income inequality, increases in social security payments reduce it, and increases in earnings from employment have an intermediate impact (though in overall terms they lean towards higher-income households who usually have two fulltime wage-earners).21ibid
Note that this provisional conclusion does not take account of changes in the distribution of incomes within each component. For example, if many people move from unemployment to fulltime employment, that is likely to reduce inequality despite the reduction in overall social security income.
In the recession, earnings were flat, investment income fell, and social security income rose, reducing overall income inequality
Figure 6 compares changes in the main components of household incomes in the financial year of the recession (from June quarter 2019 to June quarter 2020), and the first year of recovery (from June 2020 to June 2021). Changes in the overall value of each income component through each of these years are expressed as a proportion of total household after-tax incomes before the recession in June 2019.22This measure takes account of the relative weight of different income components in overall household incomes, as well as changes in the overall value of each component. For example, earnings from employment comprise three quarters of all household income.
Both the recession and the recovery had large and uneven impacts on different income components. Through the year up to and including the recession (from June 2019 to June 2020 – left column):
Changes in wages (supported by JobKeeper) increased incomes by 0.5% (in proportion to previous overall after-tax income), earnings from self-employment (also supported by JobKeeper) rose by 2.5%, while investment income fell by 3.1%.23The unprecedented levels of income support provided to employees and self employed people by the Jobkeeper Payment are described in Treasury (2021), Insights from the first six months of Jobkeeper.
- Income from social security (including Coronavirus Supplement) rose by 5.1%, while income tax increases (due to tax ‘bracket creep’) reduced incomes by 0.4%.
- Based on the typical distribution of each of these components among income groups, we would expect these changes to reduce income inequality. This is supported by the evidence presented earlier.
Figure 6: Change in household income (as a % of after-tax income in June 2019)
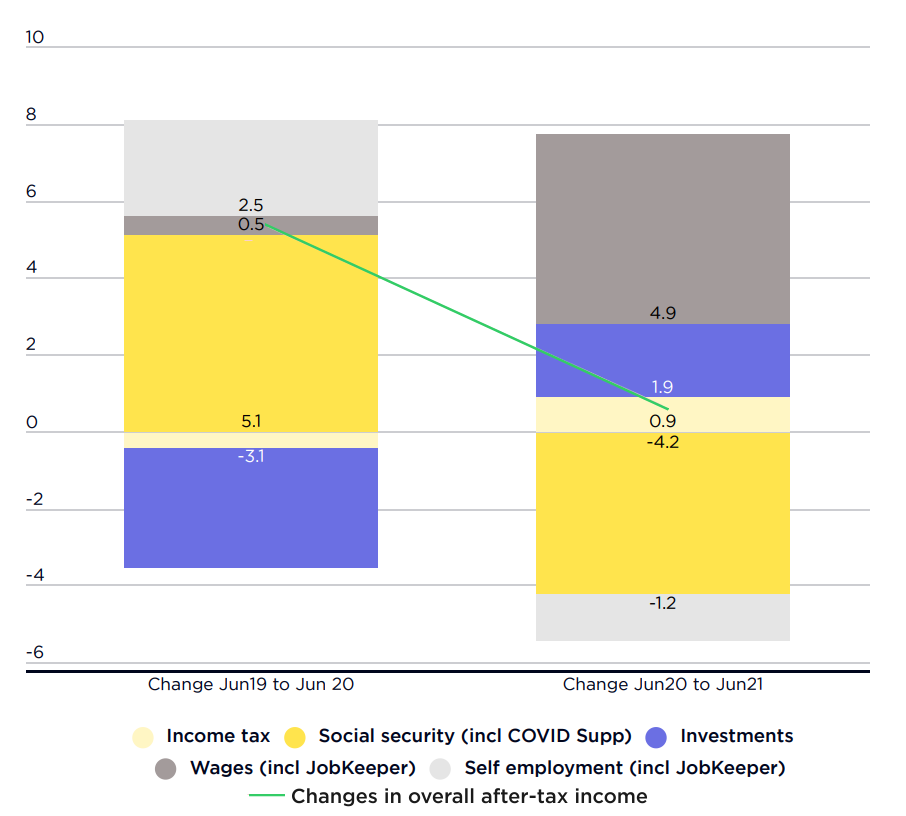
Source: Australian Bureau of Statistics, Australian National Accounts.
Note: Shows growth in different components of household income from June 2019 (before COVID) to June 2020 (recession), and from June 2020 to June 2021 (recovery), as a percentage of average after-tax household income in June 2019. Income tax is expressed in negative values (so a positive value means a reduction in tax). Note that the value of some components fell. Yellow = an increase would be expected to reduce inequality (more so if darker); Blue = an increase would be expected to increase inequality (more so if darker). Grey = an increase has an indeterminant impact on inequality.
In the recovery, earnings and investment income rose and social security income fell, likely increasing overall income inequality
Figure 6 above also shows that through the first year of recovery, from June 2020 June to June 2021 (right column):
- Changes in wages increased overall after-tax income by 4.9% of previous overall after-tax income (as paid working hours increased, partly offset by the removal of JobKeeper), self-employment earnings fell by 1.2% (as JobKeeper was removed), and investment income rose by 1.9% (as financial markets recovered).
- Social security changes reduced overall after-tax income by 4.2% and income tax cuts increased incomes by 0.9%.
All things equal, these changes in income components (which largely move in the reverse direction to the previous year), are likely to increase income inequality.
In the recovery, employment growth skewed towards higher-paid occupations
The above analysis tells us how the overall composition of household incomes changed in recession and recovery, but not how income within each component was distributed among households. To assess this, we must wait for more detailed data on the distribution of household incomes after December 2020.
Since income from paid work comprises three-quarters of all household income, any changes in its distribution across low, middle and high-income households during the recovery are likely to significantly impact overall income inequality. For example, if lower-paid jobs recovered more strongly than higher-paid positions, this was likely to reduce income inequality (depending how low-paid and higher-paid jobs are distributed within households).
The available data on changes in employment among lower, middle and higher-paid occupations indicates that growth in employment in the recovery so far has skewed towards higher-paid positions, probably increasing income inequality (Figure 7). From August 2020 to August 2021 (centre bars):
- The number of people employed in lower-paid occupations rose by 71,000;
- The number in middle-paid occupations fell by 5,000;
- The number in higher-paid occupations rose by 251,000.24While many workers in these broad occupational groups have higher or lower pay than indicated, this classification is likely to be broadly accurate. The OECD reached similar conclusions from its analysis of data on employment by industry. It found that the number of jobs paying the highest one-third of wages increased by 5.6%, the number in the middle-third fell by 1.4%, and the number in the lowest third rose by 1.4% (OECD 2021, Economic Surveys, Australia).
Figure 7: Change in number of workers employed by occupation (000s)
1.3 Conclusion – income inequality
The evidence suggests income inequality fell in the recession and rose in the recovery
In respect of the recession year from June 2019 to June 2020, analysis of trends in income components, especially the large increase in overall social security income and the large reduction in overall investment income, supports our earlier finding that income inequality declined.
The reversal of both of these changes in the value of income components in the first year of recovery from June 2020 to June 2021 suggests that, all things equal, income inequality increased. We need more information on the distribution of incomes within each component to draw a firm conclusion. Evidence that employment growth in the recovery skewed towards higher-paid jobs supports our preliminary view that income inequality increased.
This is very different to the outcome of a ‘normal’ recession, where the inequality-reducing impact of social security is overwhelmed by the inequality-increasing impact of higher unemployment. This is not, however, a ‘normal recession’, since:
- Unemployment payments were almost doubled (as discussed later);
- JobKeeper Payment flattened the distribution of wages, by increasing pay for many part time workers and levelling it down to around the minimum wage for fulltime workers.25Treasury (2021), op cit.
In part two we turn to the impact of the recession, recovery and COVID income supports on poverty and financial stress. The evidence discussed includes estimates of poverty using a microsimulation model (Phillips B, Gray M & Biddle (2020), COVID-19 JobKeeper and Jobseeker impacts on poverty and housing stress, ANU Centre for Social Research and Methods), and financial stress surveys. We also examine changes in income support payment levels (compared to poverty lines), and access to COVID income support payments by people out of paid work.
2.1 Changes in poverty levels
Phillips et al estimated poverty levels during the recession and early stages of the recovery up to January 2021, using a poverty line set at 50% of equivalent disposable household income (which they estimate was $416pw for a single adult living alone). The results shown here were adjusted to take account of housing costs.26Phillips B, Gray M & Biddle (2020), COVID-19 JobKeeper and Jobseeker impacts on poverty and housing stress, ANU Centre for Social Research and Methods
Poverty reduced by half during the recession due to COVID income supports
Figure 8 compares poverty rates before and after the recession, and with and without the extra COVID income supports (mainly the Coronavirus Supplement and JobKeeper Payment):
- In June 2020, 9.9% of people were below the poverty line, compared with 11.8% in 2019 and 22.7% who would have been in poverty in June 2020 without the new income supports (Figure 8a).
- An estimated 2,613,000 people were in poverty in June 2020, well below the 3,018,000 in 2019, and half the number that would have been in poverty (5,772,000) in June 2020 had COVID income supports not been introduced (Figure 8b).
Again, this confounds the traditional view on the impact of recessions on incomes. If income support payments sit below the poverty line, an increase in unemployment is likely to be associated with an increase in poverty.27Again, this confounds the traditional view on the impact of recessions on incomes. If income support payments sit below the poverty line, an increase in unemployment is likely to be associated with an increase in poverty.
Figure 8(a): Poverty with and without COVID income supports (% of all people)
Figure 8(b):Poverty with and without COVID income supports (number of people)
Poverty increased during the recovery
Figure 8 (above) also shows that poverty increased during the recovery, as the COVID 19 income supports phased down:
- From 9.9% in the recession in June 2020 to 14% at the end of that year (when the Coronavirus Supplement was reduced to $125pw);
- From 2,613,000 people in June 2020 to 3,820,000 in January 2021 (when the Supplement was reduced further to $75pw).
The impact of these income support changes on poverty levels is discussed in more detail later in this report.
Poverty among people on income support payments fell sharply in recession and rose sharply in recovery
Given the substantial increases in income support for those on the lowest incomes in response to COVID19 – especially the $275pw Coronavirus Supplement for people on the lowest income support payments – it is not surprising to find that poverty among people on working age income support payments fell even more sharply in the recession (Figure 9):
- Poverty among people in households on Jobseeker Payment fell by four-fifths, from 76% in 2019 to 15% in June 2020.
Poverty among people in sole parent families (both adults and children) was reduced by almost half, from 34% to 19%. On the other hand, poverty in couple families with children (who were less likely to receive the Coronavirus Supplement) rose from 7% to 9%.28It is not clear from these estimates whether the overall level of poverty within families with children (a different statistic to child poverty as it includes adults in those families) rose or fell in the recession. In 2017, approximately one third of people in poverty in families with children were in sole parent families and two thirds were in couple-with-children families (Davidson, P., Bradbury, B., and Wong, M. (2020), Poverty in Australia 2020: Part 2, Who is affected? ACOSS/UNSW Poverty and Inequality Partnership Report).
These reductions in poverty were partly reversed after the Coronavirus Supplement was reduced to $125pw from September to December 2020:
- Poverty among people in households on Jobseeker Payment rose to 48%;
- Poverty among people in sole parent families rose to 31%.
Figure 9: Poverty among Jobseeker recipients with and without COVID income supports (% of all)
2.2 Changes in financial hardship and stress
Financial stress declined in the recession, especially among people on social security payments
Figure 10 compares financial stress indicators among people whose main income was social security and the overall population, before and shortly after the recession. There were significant reductions in financial stress over this period. Between September 2019 and December 2020:
- The proportion of people reporting the most severe financial stress (three or more indicators) fell from 23% to 18% among those on social security payments and from 13% to 11% among the overall population.
- The proportion with no stress indicators rose from 51% to 54% among those on social security payments and from 66% to 68% among the overall population.
Figure 10: Financial stress in recession and recovery (2020)
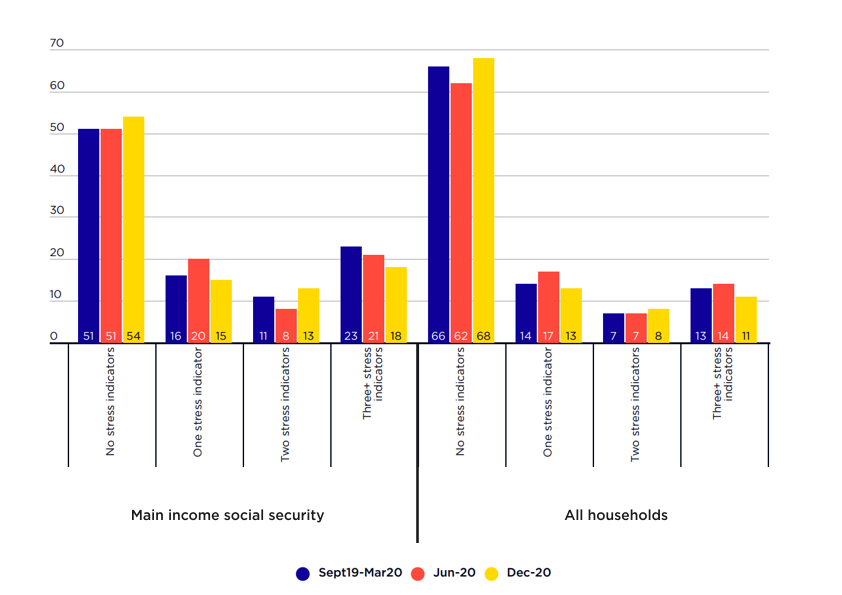
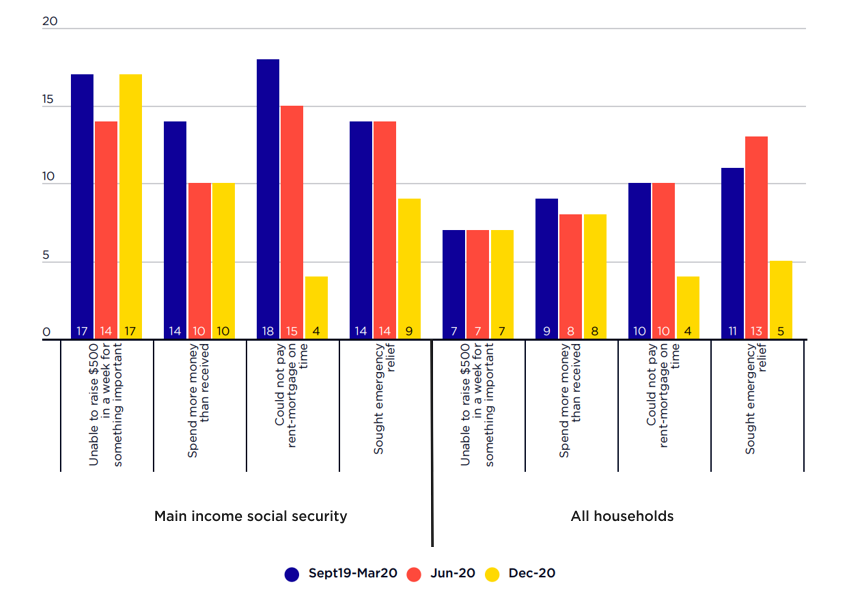
Figure 11 shows trends in key financial stress indicators. From September 2019 to December 2020:
- The proportion of people on social security unable to pay their rent or mortgage on time fell from 18% to 4%, while the proportion of the overall population fell from 10% to 4% (aided by rent and mortgage amnesties);
- The proportion of people on social security seeking emergency relief fell from 14% to 9% while the proportion of the overall population fell from 11% to 5%.29 Significantly, there was an increase in demand for emergency relief among temporary migrants (such as students) who were denied access to Jobkeeper Payment and most other forms of income support (ACOSS 2020, Who misses out on access to Australia’s safety net under Covid19?)
Figure 11: Financial stress among social security recipients and all people (2020)
Another sign of reduced financial stress (and restrictions on the ability to spend on such items as travel) was the sharp increase in household saving during 2020. The household saving ratio rose from 5% of after-tax income in 2019 to a peak of 22% in the midst of the recession in the June quarter of 2020.
After COVID income supports were removed in April 2021, more people reported financial stress
Figure 12 shows trends in a similar measure of financial stress (the NAB financial stress index) from 2014 to the June quarter of 2021. The bank’s economists report that between the March and June quarters of 2021 (when the JobKeeper Payment and the Coronavirus Supplement were removed):
‘Financial stress rose for low income-earners (up 4.6 points to 52.5) but fell for higher income earners (down by 0.9 points to 37.4), with the gap now at its widest since the first quarter of 2020.
‘Lower income earners were more concerned about all financial stress metrics, especially raising $2,000 for an emergency, (56.1 compared with 34.2 for higher income earners) major household items (56.5 Vs 37.4), monthly utility bills (52.1 Vs 33.9) and not having enough for food or basic necessities (47.4 Vs 29.4).
‘Financial stress remains highest for unemployed people (62.1), particularly financing retirement (71.4) and the ability to raise $2,000 in an emergency (69.7).
(National Australia Bank 2021, Financial wellbeing survey, August 2021, p1).
Along with the ABS survey data above, this measure of financial stress fell sharply in the second quarter of 2020, despite the recession. It then rose sharply in the first two quarters of 2021 among people on low incomes as COVID income supports were reduced and then removed.
Figure 12: NAB financial stress index (2014 to June 2021)
Demand for food relief rose in the latest lockdowns to a similar level as last year’s recession.
Figure 13 shows trends in internet searches for food relief from before the recession in October 2019 to the latest lockdowns in September 2021:
- This shows similar peaks in searches for food relief at the start of the national lockdown in March 2020 and those in Sydney, Melbourne and Canberra in August 2021.
- Significantly, demand fell between March and July 2020 as COVID income supports were introduced, and gradually rose through 2021 after they were removed.
Figure 13: Internet searches for food assistance (October 2019 to September
2.3 The main drivers of changes in poverty levels
We now examine changes in the level and coverage (incidence) of COVID income support payments for those affected by the recession and subsequent lockdowns, and their impact on poverty levels.
The number of people on the lowest income support payments rose by 60% in the recession
Before the pandemic (in 2017-18), 40% of people in households whose reference person received the lowest income support payments (including Jobseeker Payment, Youth Allowance, Austudy Payment and Parenting Payment) were living below the poverty line.30 Davidson, P., Bradbury, B., Hill, T. and Wong, M. (2020), Poverty in Australia 2020: Part 1, Overview ACOSS/UNSW Poverty and Inequality Partnership Report
The number of people receiving those payments rose by two thirds from 1,329,000 in September 2019 (before the recession) to 2,242,000 in June 2020 (during the recession). It gradually fell to 2,050,000 in December 2020 and stood at 1,662,000 in September 2021 (25% higher than two years previously).31These were the main income support payments for people affected by the reduction in employment and paid working hours in the COVID recession. Consequently, people on these payments received the Coronavirus Supplement. Note, however, that many people at risk of poverty (especially temporary migrants) were not eligible for income support.
Combined with Jobseeker Payment, the Coronavirus Supplement lifted single people above the poverty line in the recession, but they drifted below it as it was reduced.
As we have seen, the $275pw Coronavirus Supplement was well targeted to reduce poverty, with around 40% of that payment going to people in the lowest 20% of households by income (Figure 4). JobKeeper payment played a lesser but significant role with 10% of payments going to the lowest 20%.
To assess whether these extra income supports lifted people above the poverty line, Figure 14 compares the poverty line for a single adult living alone with maximum rates of JobSeeker Payment together with Rent Assistance and the Coronavirus Supplement, JobKeeper Payment, and the COVID-19 Disaster Payment (introduced later and discussed below). All values are expressed as a proportion of the median weekly fulltime wage.32For a more comprehensive discussion of trends in income support payments during this period, see Bradbury B & Hill P (2021), Australian income support since 2000 – those left behind.
The income supports available to a single adult without children who was unemployed were set above the poverty line in the recession, but drifted below it as the Coronavirus Supplement was reduced:
- In June 2020 (when the Supplement was $275pw) their income was around 30% above the poverty line.
- In September 2020 (after it was reduced to $125pw) they were close to the poverty line.
- In March 2021 (after it was reduced to $75pw), they were around 15% below it.
- In June 2021, (after the $25pw increase in Jobseeker Payment in April 2021 failed to offset the removal of the Supplement) they were once again around 30% below the poverty line.
This simple comparison of payments and poverty lines for a single adult does not take account of the diversity of families of different sizes and housing costs, which also determine whether a household falls below the poverty line.33This, together with gaps in the income support safety net (for example for temporary migrants) is the reason some households were still living in poverty during the recession despite the large increase in income support. Incongruously, neither Family Tax Benefits nor Rent Assistance were increased at this time.
Figure 14: COVID income support for unemployed & fulltime employees (% of median fulltime wage)
JobKeeper Payment for a fulltime worker was set at around half the median wage in the recession but was later reduced to around the poverty line.
Figure 14 (above) shows changes in the value of JobKeeper Payment for those who lost or were stood down from fulltime employment during lockdowns:
- In June 2020, it was set at $750pw, around half of the median fulltime wage and close to the minimum wage.
- The effect of this flat-rate payment was to compress the wage distribution. At this time around half those on the payment experienced a reduction in pay while around a quarter (mainly part time employees) received an increase.34 Treasury (2020), Jobkeeper Payment three-month review. See also ACOSS & UNSW Sydney (2021), Analysis of income support in the COVID lockdowns in 2020 and 2021. From September to December 2020, a lower part-time rate of $375pw was introduced for people previously employed for 20 hours a week or less. People employed on a casual basis for less than 12 months and most migrants on temporary visas were excluded.
JobKeeper Payment was subsequently reduced, and then abolished in April 2021:
- By March 2021 it was $500pw, around one third of the median fulltime wage and close to the poverty line.35 The rate for part time employees was $375pw in September 2020, falling to $325pw in January 2021. See Treasury (2021) op cit.
The COVID-19 Disaster Payment was set at similar levels to JobKeeper and the Coronavirus Supplement
Figure 14 (above) also shows the value of the COVID-19 Disaster Payment in place during the final quarter of 2021:
- For fulltime workers stood down, it was paid at $750pw or 51% of the median fulltime wage.
- A minority of people on income support payments received a $200pw supplement, lifting the income of a single adult to around 15% above the poverty line.
COVID income support payments reached over a third of the workforce in the recession
During the recession in June 2020, 2.2 million people on working-age income support payments (equal to 17% of the labour force) received the Coronavirus Supplement and 3.6 million people who were still employed (equal to 27% of the labour force) received JobKeeper Payment (Figure 15). These two COVID payments were reduced in late 2020 and removed in April 2021.
Figure 15: Recipients of Coronavirus Supplement, Jobkeeper Payment and COVID Disaster Payments (% of labour force)
Half the country was locked down again in September 2021 with weaker income supports
For most of the period from August to November 2021, Sydney, Melbourne the Australian Capital Territory, and parts of regional New South Wales, Victoria and Queensland, were locked down again. To support those affected by loss of employment or paid working hours, a COVID Disaster payment was introduced (see Attachment). This payment had separate components for people not on income support payments (in lieu of JobKeeper Payment) and those on income support (in lieu of Coronavirus Supplement).
Among those not on income support, Figure 15 shows that the COVID-19 Disaster Payment was paid to 13% of the labour force (1,768,000 people).
The $200pw payment for those on income support was much more narrowly targeted than the Coronavirus Supplement (which was paid to all people on the lowest working-age income support payments). The COVID-19 Disaster Payment was limited to people who lost paid work in the latest lockdowns:
- In September 2021 there were 927,000 people in the locked-down States and Territories on the lowest income support payments.
- Of these people, only 162,000 (17%) received COVID Disaster Payment (equivalent to 1% of the labour force as shown in Figure 15 above).
- The impact of lockdowns on the employment prospects of the other 765,000 people (83%) already receiving income support was ignored as they were excluded from the COVID Disaster Payment. As shown above, they faced a high risk of poverty.
COVID-19 Disaster payments will be withdrawn before the end of 2021 regardless of labour market conditions
The COVID-19 Disaster Payments were removed two weeks after each State or Territory affected by lockdowns reached the National Cabinet’s double-vaccination target of 80% of people over 16 years. People in regions affected by the latest lockdowns or border closures lost these payments regardless of whether their employment prospects were still adversely affected.
Those unable to secure employment were left to rely on manifestly inadequate income support payments such as the $45 a day JobSeeker Payment.
2.4 Conclusions: Poverty and financial hardship
As with income inequality, the evidence suggests that poverty fell in the recession and rose in the recovery
The rate of poverty fell from 11.5% (3 million people) in 2019 to 9.9% (2.6 million people) in June 2020 in the depths of the recession, then rose to 14% (3.8 million people) at the end of 2020 (Figure 9).
The key influence on these trends was the introduction and subsequent withdrawal of the Coronavirus Supplement, which lifted income support payments above the poverty line. A single adult on Jobseeker Payment together with Rent Assistance and Coronavirus Supplement had a total income of approximately:
- 30% above the poverty line in June 2020 (when the Supplement was $275pw),
- close to the poverty line in September 2020 (when it was cut to $125pw),
- 30% below it in June 2021 (after the Supplement was removed, despite the ongoing $25pw increase in Jobseeker and related payments).
These changes in payments made a real difference to people’s ability to meet their basic living expenses. Measures of financial stress and reliance on emergency relief significantly declined during the recession (despite higher unemployment) and rose in the recovery as Coronavirus Support and JobKeeper Payment were withdrawn.
The COVID-19 Disaster Payment for people affected by lockdowns in the Delta wave of the pandemic was much more narrowly targeted, excluding 83% of those on the lowest income support payments. Unlike the Coronavirus Supplement the year before, it is unlikely that those payments significantly reduced the overall level of poverty.
Table A1: Timeline of the pandemic impacts and policy responses
Sources: ABS, Household Financial Resources reports ; APRA (2021), Quarterly superannuation performance statistics highlights; Corelogic (2021), Home value index; Parliamentary Library (2020), COVID-19 a chronology of state and territory government announcements; Parliamentary Library (2021), Australian Government COVID-19 disaster payments; Parliamentary Library (2020), Changes to the COVID-19 social security measures; Credit Suisse (2020), Global wealth report 2020; Reserve Bank of Australia (2021), Cash rate target; Australian Taxation Office (2020), COVID-19 Early release of super report; Reserve Bank of Australia, International share price indices.
Figure A1: Proportion of all people in lockdown (March 2020 to September 2021)
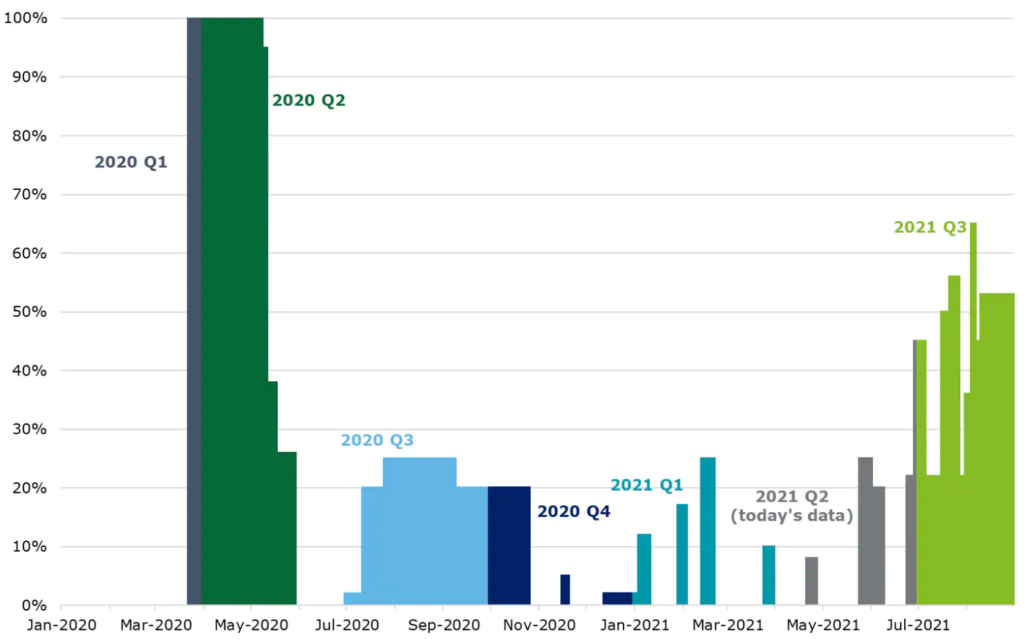 Source: Derwin J (2021), ‘Australia has avoided another recession for now. But economists warn we’re in ‘the eye of the storm.’ Business Insider 1/9/2021.
Figure A2: Unemployment rate and effective unemployment rate
Source: ABS, Labour Force, Australia (detailed); ABS, Insight into hours worked, October 2021.
Note: Effective unemployment = unemployed + increase in number of people stood down for economic or ‘other’ reasons + reduction in the labour force compared to pre-lockdown levels (February 2020 and May 2021 respectively).
Figure A3: Fiscal Stimulus
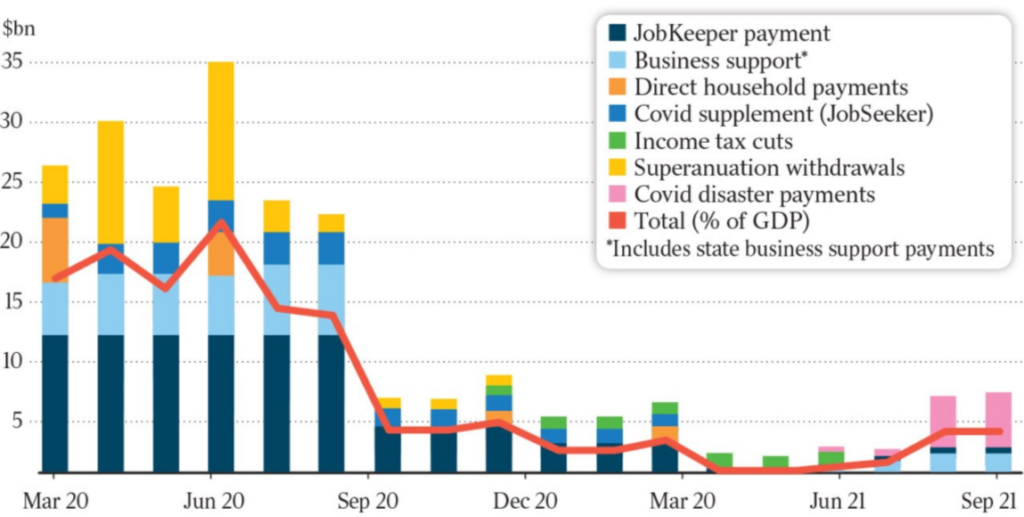
Source: Cacho C (Chief Economist, Jarden) cited in: Commins P, Targeted stimulus cuts billions off the bill, The Australian 3/9/21
Note: Monthly expenditure on COVID income supports averaged around $20 billion per month from March to September 2020, fell to less than $5 billion per month during the recovery from October 2020 to June 2021, then rose to around $7 billion per month in the second wave from August to September 2021.
ISSN: 1326 7124
ISBN: 978 0 85871 096 2
A tale of two pandemics: COVID, inequality and poverty in 2020 and 2021 is published by the Australian Council of Social Service (ACOSS) in partnership with UNSW Sydney. The views expressed in this report are those of the authors.
Locked Bag 4777
Strawberry Hills NSW 2012
Australia
Email: [email protected]
Website: povertyandinequality.acoss.org.au
© ACOSS and UNSW Sydney, 2022
This report is copyright. Apart from fair dealing for the purpose of private study, research, criticism or review, as permitted under the Copyright Act, no part may be reproduced by any process without written permission. Enquiries should be directed to the Publications Officer, Australian Council of Social Service. Copies are available from the address above.
Suggested citation: Davidson, P., (2022) A tale of two pandemics: COVID, inequality and poverty in 2020 and 2021 ACOSS/UNSW Sydney Poverty and Inequality Partnership, Build Back Fairer Series, Report No. 3, Sydney
Cover photo © by Clare Seibel-Barnes on Austockphoto.com.au