[infogram id=”_/tl566KvdfglB4AhwWJTx” prefix=”CIY” format=”interactive” title=”Figure 6.6 Median advertised rents, all property types, Australia”]
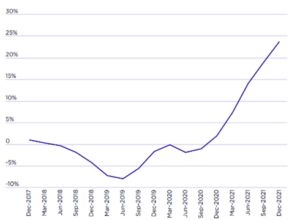
This graph shows the phenomenon of regional rents ‘outperforming’ the relevant capital city in Australia from 2019-2021. This was especially marked in New South Wales (+17% versus-2%), Tasmania (+26% versus +8%) and Victoria (+15% versus -7%). Also notable is that Western Australia, where geographical isolation and a closed border largely enabled avoidance of economic restrictions during the first two years of the pandemic, the pattern was completely different.