Causes of poverty and inequality in Australia
A combination of factors contribute to poverty – a lack of money or resources for the basic needs of life – and inequality – unequal distribution of income and wealth. These factors include:
- Australia’s social security system: Our system for supporting people does not provide enough help to prevent people from slipping into poverty. Currently, the system is not working because the rates of JobSeeker and Youth Allowance have not been increased in real terms for 25 years, while the cost of living, especially housing, has risen dramatically.
- Unemployment and underemployment: There are not enough jobs available for people who are looking for paid work; and there are people who, while employed, need more paid work. There is only one job available for every eight people looking for paid work, and often those jobs require specific skills or knowledge about new technologies.
- Increased costs of living, especially housing: The cost of housing and essential services is increasing. We all need a home. None of us can go about our lives, raise a family, go to work or stay healthy, without a stable and safe place to call home. Our housing system should make sure everyone has a secure, safe roof over their head.
The labour force status of the main income-earner in a household makes a major difference to poverty rates among people of working age. Among people in households where the reference person is unemployed, 68% are in poverty (using the 50% of median income poverty line), and if they are not in the labour force (for example have a disability or fulltime caring responsibilities, it is 45%. In contrast where the main income-earner is employed fulltime the poverty rate is 6% and where they are employed part-time, it is 15%.
The relatively low poverty rate among families relying on a fulltime wage reflects the fact that the minimum wage is above the poverty line for a single adult. However, some families with children relying on a single minimum wage fall below the poverty line.
From 1999 to 2018, the unemployment rate fell from 8.4% in 1999 to 5.1%, which (all things equal) reduced poverty. On the other hand, underemployment (being employed part time but unable to secure more paid hours) rose from 6% in 1999 to 8.6% in 2018.
Unemployment and underemployment (2004-16)
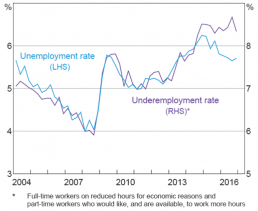
SOURCE: Bishop J & Cassidy N (2017): Insights into low wage growth in Australia RBA Bulletin, March 2017
Also offsetting the impact of lower unemployment on poverty is the lack of any increase in the main unemployment payments (Newstart and Youth Allowance) beyond inflation over this period, and the growing share of recipients of those payments who relied on them for a year or more (rising from 57% to 65%). In March 2018, 822,000 received those payments, of whom 534,000 were long-term recipients.
Lower employment rates among migrants from non-English speaking countries are likely to contribute to their above average poverty rate.
In Australia, housing represents the highest cost in most family budgets. Therefore, those with lower housing costs – especially those who own homes outright – can achieve a higher standard of living than people on the same income but with higher housing costs.
Poverty
Whether people own or rent their homes has a huge impact on poverty after housing costs. 52% of people living below the poverty line are renters, while only 15% are people who own their homes outright. Housing status is the main factor that determines whether or not someone over the age of 65 is living in poverty – 43% of tenants aged 65 and over are in poverty, compared with only 12% of all people aged over 65.
The risk of poverty is twice as much for households renting privately than for home-owners or those in the process of buying a home. Poverty is higher again for people in public or community housing, due in part to the lower incomes among this group.
Increased housing costs for households on low incomes since the GFC has helped to keep poverty rates high. Between 2007-2015, average housing costs for Age Pension recipients increased by 45%, and for Parenting Payment recipients by 32%. Both of these are significantly higher than the overall 27% rise in median housing costs over the same period.
Inequality
Housing also impacts inequality levels. The average value of owner-occupied housing held by the under-35 age group is declining, reflecting the growing difficulties many younger people face in raising the funds to purchase their first home.
The wealth of the lowest wealth group is more likely to be built of low-value assets like cars and home contents, rather than owning their own home. Overall, from 2003-04 to 2015-16, the share of owner-occupied housing wealth in all household wealth fell from 45% to 39%, though it remained the largest component.
Income inequality
Earnings comprise the majority (77%) of household incomes and for this reason have a substantial impact on inequality. The highest 20% of households receives almost three times the average before-tax earnings of the middle 20%, which in turn has three times the average earnings of the lowest 20% (most of whom are not in paid employment).
While investment incomes form a much smaller proportion of incomes (11%), they are much more unequally distributed, especially at the top. The highest 20% has almost five times the average before-tax investment income of the middle 20%, and the middle 20% has three times that of the lowest 20%.
Social security plays a vital role in reducing income inequality by boosting the incomes of those with little or no private income. Among the lowest 20% of households, 55% of pre-tax income comes from social security, compared with 10% for the middle 20% and 1% for the highest 20%.
Income taxes also have a progressive impact because high-income earners pay a greater share of their incomes in tax. Individuals in the highest 20% of households pay an average of 26% of their income in tax (the average, not marginal tax rate), compared with 15% for the middle 20% and 4% for the highest 20%.
Income inequality grew in most wealthy countries, including Australia, from the early 1980s, after declining substantially over the previous 40 years, following World War II. The Organisation for Economic Cooperation and Development (OECD) reports that on average in wealthy countries in 2015, the highest 10% of people by income earned 9.6 times the income of the lowest 10%. In the 1980s, that ratio stood at 7:1, rising to 8:1 in the 1990s and 9:1 in the 2000s.
In Australia from the mid 1990s to the mid 2010s, which was mostly a period of strong economic growth, an increase in earnings inequality among individuals (as seen in this graph) contributed to rising household income inequality.
Strong investment returns over this period, especially in share-markets, accrued disproportionately to high income –earners, also increasing income inequality.
Reflecting lower unemployment and higher labour force participation during this period, the share of households relying on income support payments for more than half of their income declined from 22% in 1999 to 17% in 2007, reducing the impact of social security on income inequality.
A succession of income tax cuts from 2000 to 2011 mostly benefited those on higher incomes rather than those on lower incomes, reducing the progressivity of the tax system over that period.
Since the Global Financial Crisis (GFC) in 2008, inequality has stabilized, largely because household incomes grew much more slowly across the income distribution. On average, household incomes grew by just 3% (after inflation) over the entire period from 2007-2017. The main drivers for this included much slower growth in hourly wages (less than 3% from 2013 to 2016, compared with over 4% from 2004 to 2008) and declines in investment returns (apart from an investment housing boom).
Poverty
Because the poverty line is a measure relative to median income, changes in ‘middle’ incomes affect the poverty rate.
Median household incomes grew very strongly in the boom years from 2003 to 2007, and poverty rose over that period as the incomes of many people out of paid work or on low wages failed to keep up.
Since 2008, median household disposable incomes (and the poverty line) have grown much more slowly (by an average of just 0.5% a year to 2017), contributing to the stabilisation of poverty levels. However, reducing income growth for everyone is not the way to stop people being left behind. Policies for inclusive growth are needed, so that the incomes of those with the last grow as quickly, or even more quickly, than the rest of the community at peak times.
Social security policy has a major impact on poverty levels. A $32pw pension increase in 2009 reduced poverty, especially among older people. On the other hand, the freezing of Newstart Allowance (after inflation) for 25 years, together with the transfer of 80,000 sole parents to that payment in 2013, increased poverty among those affected.
Solutions
Our research demonstrates the role played by public policy – especially social security and taxation, but also housing and employment policy, among other areas – in determining the rate of poverty and inequality in Australia.
ACOSS has developed a suite of policy reform proposals to address to reduce poverty and inequality in Australia in the following areas:
Australia’s income support system should play a key role in poverty prevention. However, many income support payments are inadequate on their own to prevent poverty. Consequently, where income support is the main source of income for a household, there is a high risk of that household living in poverty.
JobSeeker
JobSeeker is the main income support payment for people who are unemployed. This payment is also received by parents with middle-age children, and people with disability or illness who do not qualify for the Disability Support Pension.
The gap between the poverty line and the maximum rate of JobSeeker for a single person is currently $106 a week. This gap is increasing because JobSeeker is indexed to price movements, while the poverty line moves in line with wage growth, which typically increases at a higher rate than inflation.
JobSeeker has not increased in real terms since 1994 despite the vastly increased cost of living.
The low rate of JobSeeker has also led to people receiving the payment being overrepresented among people in the lowest 5% of income brackets.
Youth Allowance
Youth Allowance is the main income support payment for young people who are unemployed or studying. Receipt of this payment poses the biggest risk to living in poverty.
For a single young person living away from their parents’ home, Youth Allowance is $52 a week less than JobSeeker Allowance at $227pw. The gap between the poverty line and Youth Allowance for a single person is $148 a week.
Like JobSeeker, Youth Allowance receives only CPI increases. Unlike JobSeeker, it is only indexed once per year. Consequently, poverty for people receiving Youth Allowance will increase over time.
Pensions
Pension payments include the Age Pension, Disaibility Support Pension and Carer Payment.
Pensions are paid at much higher rates than allowances, largely because they are indexed to wage growth as well as price rises, and there was an historic increase to pensions in 2009, where single rates increased by $32.50 per week. This reform substantially reduced poverty among pensioners. As a result of these policy settings, pensions for people without children are now very close to the 50% of median income poverty line.
Single parent payments
Payments for single parents consist of Parenting Payment Single, JobSeeker (where the youngest child is at least eight) and Family Tax Benefits. Before 2009, Parenting Payment Single was paid at the same rate as pension payments, but it did not receive the increase in 2009.
Single parents receiving JobSeeker are at greatest risk of poverty. When 80,000 single parents were denied Parenting Payment Single when their youngest child turned eight in 2013, poverty among unemployed single parents almost doubled to 59%. A single parent family on JobSeeker that rents privately and has two school-age children receives $105 a week less than the poverty line.
Commonwealth Rent Assistance
This is a payment for people receiving income support payments who are renting privately or in community housing. Rent Assistance, too, is indexed to CPI rather than to growth in rents, meaning that it has not maintained pace with private rent.
History of social security indexation changes
Aside from the 2009 pension increase, other major income support reforms since 2005 include: