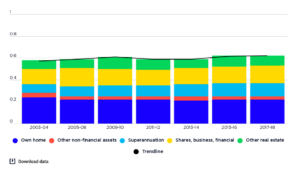
This graph compares the increase in real value (after inflation is taken into account) of average wealth holdings of each wealth group.
Between 2003-04 and 2017-18:
- The average wealth of the highest 20% wealth group rose by 68%.
- The average wealth of the middle 20% wealth group rose by 36%
- The average wealth of the lowest 20% wealth group rose by 6%.