One in eight people in Australia are living in poverty
One in eight people in Australia, including one in six children are living in poverty, a new report released on the eve of Anti-Poverty Week has found, as cost of living pressures continue to put households under strain.
As many as 13.4 per cent of the population (or 3.3 million people) and 16.6 per cent of children (or 761,000 kids) were living below the poverty line in the first year of the pandemic (2019-20), according to the Poverty In Australia 2022 report by the Australian Council of Social Service and UNSW Sydney, using the latest available data from the ABS.
The study also revealed people in poverty are falling further behind the rest of society, with their average weekly incomes dropping to $304 below the poverty line.
The report found that temporary income supports introduced during COVID lockdowns in 2020 – the Coronavirus Supplement and Economic Support Payment - pulled 646,000 people, including 245,000 children, above the poverty line. Those new supports almost doubled the lowest income support payments, including the JobSeeker Payment.
These results demonstrate that Australia can swiftly reduce poverty by raising income supports.
In the first three months of 2020, as large parts of the economy were shut down by Covid restrictions and thousands were put out of work, the poverty rate soared to 14.6 per cent.
But boosted income support payments announced in April that year saw the poverty rate drop to a 17-year-low of 12 per cent over the next three months.
The effect of the boosted payments on children was even more dramatic, reducing the child poverty rate from 19 per cent in the March quarter of 2020 to a 20-year low of 13.7 per cent in the June quarter of 2020, lifting 245,000 children above the poverty line.
The extra income meant that single adults receiving social security payments went from being $134 a week below the poverty line in March to $146 above it in June 2020, while couples with two children went from being $187 below the poverty line to $361 above it at the same time. However, by April 2021, Coronavirus Supplement (initially $275 a week) was abolished and in its place Jobseeker and related payments were increased by just $25 a week.
Professor Carla Treloar, Director of the Social Policy Research Centre at UNSW Sydney, said the report highlights the unacceptable levels of poverty in our nation.
‘Australia is one of the wealthiest countries in the world, yet we have one in eight people and one in six children living below the poverty line,’ she said.
‘There are 3.3 million people in Australia desperately struggling to pay the bills and put food on the table. There are 761,000 children who are denied a good start to life.’
ACOSS CEO Dr Cassandra Goldie said: ‘These figures should be a source of great shame for our nation. We can and must do better.
Dr Goldie also said the study showed there is a clear way to reduce poverty in Australia: ‘Almost doubling the JobSeeker rate pulled 646,000 people out of poverty in 2020. That is a huge advance in an incredibly short period of time.’
‘The increased payments reduced child poverty by a massive 5.3 per cent, giving 245,000 kids in Australia the chance of a better future.
‘The report shows that the solutions to ending poverty in Australia are clear. Increasing Jobseeker and related payments to at least $73 a day is a crucial first step, as well as an increase to Commonwealth Rent Assistance and a substantial investment in social housing so that there are enough affordable homes for people on the lowest incomes. We must also invest in energy efficiency and solar retrofits for low-income homes.
'As it develops its approach to a well-being budget, the Federal Government should prioritise including specific targets and strategies for reducing poverty to ensure that no one is left behind.
‘ACOSS agrees with the Treasurer that we need to have a conversation about how we can grow the revenue Australia needs to pay for the essential services and safety net we need, to end poverty and deliver wellbeing and we are keen to work with the government on this.’
Read the report at: https://bit.ly/PovertySnapshot
Key findings in the report:
- The poverty line (based on 50% of median household after-tax income) is $489 a week for a single adult and $1,027 a week for a couple with two children, according to the latest available data from the ABS (2019-20).
- More than one in eight people in Australia (13.4 per cent) lived below the poverty line in 2019-20, the first year of the pandemic. That amounts to 3,319,000 people.
- One in six children (16.6 per cent) live in poverty. That amounts to 761,000 children.
- The poverty rate soared to 14.6 per cent in the March quarter of 2020 due to Covid-19 restrictions.
- But it fell to 12 per cent – a 17 year low – in the June quarter of 2020 due to boosted income support payments - The boosted payments brought 646,000 people – or 2.6 per cent of all people – out of poverty.
- The child poverty rate rose from 16.2 per cent in the September quarter of 2019 to 19 per cent in the March quarter of 2020, then fell to 13.7 per cent – a two-decade low – in June 2020.
- Average weekly incomes of people in poverty (from different-sized families) are $304 below the poverty line. This is known as the poverty gap.
- The poverty gap increased steadily from $168 a week in 1999 to $323 in March 2020 and fell to $310 in June 2020 due to the extra Covid-19 income support.
- Boosted income support pushed weekly social security payments for single adults with no private income from $134 below the poverty line to $146 above it. Single parents with two children went from $119 below to $176 above the poverty line. Couples with no children went from being $152 below to $411 above the poverty line while couples with two children went from being $187 below the poverty line to $361 above it.
The study was based on ABS data for the 2019-20 financial year, which is the latest available. The 13.4 per cent poverty rate and 16.6 per cent child poverty rate are the yearly average.
The poverty line is defined as 50 per cent of median after-tax household income, adjusted for household size.
Average wealth per adult in 2020
According to Credit Suisse’s Global Wealth Report, the average wealth of Australian households was $628,000 per adult in 2020, the fourth highest in the world behind Switzerland, the United States and Hong Kong (North America as shown on the graph refers to the region, as does Asia-Pacific and Europe).
Average wealth of households by age, as a percentage of the average wealth of all (%)
This graph shows that wealth inequality has increased across generations since 2003, especially in the distribution of owner-occupied housing. As a proportion of the average value of owner-occupied homes held across all age groups:
• The average value held in households with a reference person under 35 years fell from 31% in 2003 to 26% in 2021;
• That of those aged 35-44 years fell from 82% in 2003 to 69%;
• That of those aged 64 years rose from 140% in 2003 to 144%.
The Wealth Paradox - wealth inequality and the housing crisis
A new report being launched today by the ACOSS/UNSW Sydney Poverty and Inequality Partnership, The wealth inequality pandemic: COVID and wealth inequality confirms that even though Australians are now, on average, the fourth richest people in the world, the distribution of our wealth remains hugely unequal.
Our overall household wealth has grown as much in the last 3 years as it did in the previous fifteen, despite the COVID-19 pandemic and the recession in 2020, thanks mainly to the soaring cost of residential properties across the country during that same period.
Soaring housing prices and their impact
Over two-thirds (69%) of the overall increase in household wealth during the pandemic was in residential property, which rose in value by 22% through the year to December 2021 - the highest annual increase in 35 years.
Rising house prices increase the divide between people who bought their homes when they were more affordable, and younger people and those on low and modest incomes who are shut out of home ownership or struggle with escalating rents and mortgage payments.
Although markedly worse of late, the situation is not new. Over the period from 2003 to 2021:
- home ownership among people aged 25 to 29 fell from 44% to 38% and among people aged 30-34 it fell from 57% to 50%;
- the proportion of median household disposable income required to service a typical home mortgage rose from 27% to 41%;
- the proportion of median household disposable income required to pay the median rent rose from 26% to 31%.
Out of almost 50,000 rental listings surveyed by Anglicare Australia in May 2022, only seven were affordable (costing less than 30% of income) for a single adult on Jobseeker Payment and just nine were affordable for a single parent on Jobseeker Payment with one child.
Previous ACOSS/UNSW reports in this series have shown how the pandemic related income supports and rental assistance offered by the Government early on helped to lift people out of poverty. This report shows that, with a return to ‘normal settings’ and the end of such supports, mortgage increases and higher rents are putting people on low and modest incomes under incredible financial pressure.
Wealth inequality
Household wealth in Australia is very unequally divided.
- The highest 10% of households by wealth has an average of $6.1 million or 46% of all wealth.
- The next 30% has an average of $1.7 million or 38%.
- That leaves the majority – the lower 60% - with an average of $376,000 or just 17% of all wealth.
The report shows that the over 130 billionaires in Australia each hold an average of $3,600 million in wealth.
Since owner-occupied housing wealth is less unequally shared than other assets such as shares and investment property, the recent boost to housing wealth eased the growth in wealth inequality under way for the last two decades. The top 10% of households by wealth held 42% of all wealth in 2003, rising to 47% before COVID in 2018, then fell back to 46% in 2021.
Due to our high and rapidly growing home prices and relatively easy access to credit, this latest report also shows that Australian households are overcommitted or ‘more indebted’ than many other wealthy nations. The Organisation for Economic Cooperation and Development (OECD) regards households in the lowest 40% by income with debt at least three times their annual disposable income as ‘over-indebted’ and nearly a third of Australia’s low-income households are currently in this position.
Acting ACOSS CEO, Edwina MacDonald said:
“Everyone deserves a roof over their heads, and a home that meets their basic need for shelter. It is simply wrong that something so fundamental has become so challenging for those on low and modest incomes to achieve.
“This research also points to the precariousness of life for people on low incomes in Australia, 39% of who are unable to cover 3 weeks of lost income, and the need to bolster the social safety net so that unemployment does not inevitably lead to poverty.”
Scientia Professor Carla Treloar, Director of the Social Policy Research Centre (SPRC) and the Centre for Social Research in Health (CSRH) at UNSW, said:
“Once again, this report reminds us that wealth in Australia is distributed very unevenly. We have over 130 billionaires in this country, and last year the wealth of those same billionaires grew, on average, by $395 million or 12%. It means they now hold almost as much wealth as the 2.8 million households in the lowest 30%.
“This research makes it clear we have an economic model that delivers profits for the wealthiest at the expense of those with least in our community, and it’s time for the inequality in our economic system to be addressed and made fairer for all.”
Key Findings
- Households in Australia are on average the fourth richest in the world, but many are financially vulnerable due to high debt or low financial buffers.
- Household wealth grew as much over the past 3 years as in the previous 15 years. Two thirds of the increase in wealth came from house price inflation. Residential property values rose 22% through the year to December 2021 - the highest annual increase in 35 years.
- Wealth inequality rose sharply from 2003 to 2018, then declined slightly in the pandemic. Rising house prices moderated overall wealth inequality, as housing is distributed more evenly across the population than other kinds of wealth) but shut younger people and those with low incomes out of home ownership.
- Household wealth is still shared very unequally: The richest 10% of households has an average of $6.1 million and almost half of all wealth (46%), while the lower 60% (with an average of $376,000) has just 17% of all wealth.
Wealth inequality (Gini coefficient)
This graph shows trends in a summary measure of inequality, the ‘Gini coefficient’. The Gini varies across a range from zero (equal wealth) to one (where all wealth is held by a single household).
It rose sharply from 0.573 in 2003 to 0.624 in 2018; and then declined slightly to 0.613 by 2021, close to the level reached around 2016.
Share of wealth held by households ranked by wealth (% in 2021)
Consistent with the findings of our Inequality in Australia 2020 report, wealth is still very unequally distributed in 2021-22.
* The highest 10% of households by wealth has an average of $6.1 million or 46% of all wealth.
*The next 30% have an average of $1.7 million or 38% of all wealth.
* That leaves the majority – the lower 60% - with $376,000 or just 17% of all wealth.
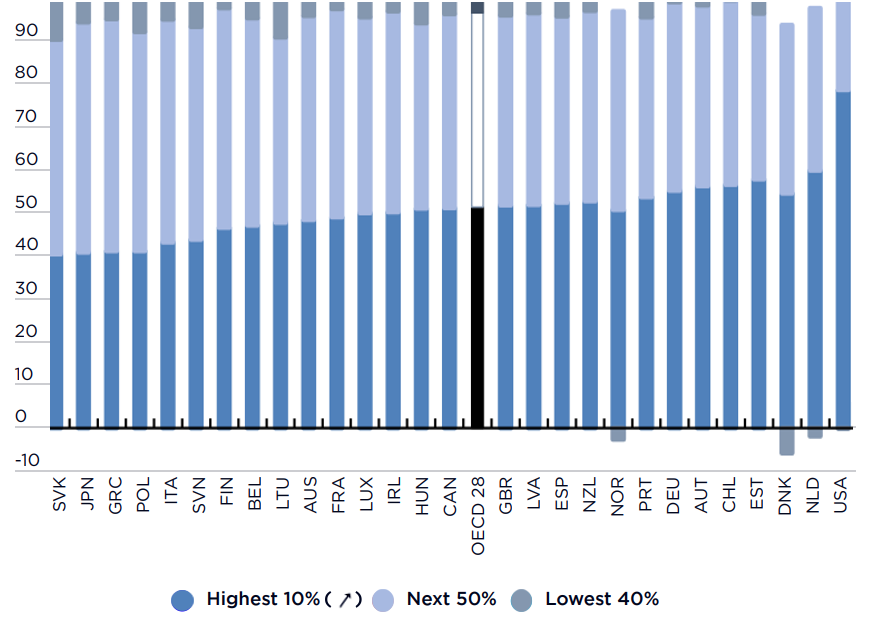
Shares of overall wealth held by the lowest 40%, middle 50% and highest 10% around 2018 (%)

The level of wealth inequality in Australia around 2018 (before the pandemic) was somewhat below the average among 28 wealthy nations surveyed by the OECD. The highest 10% of households ranked by wealth held approximately 45% of all wealth in Australia compared with an OECD average of approximately 50%.
The high level of home ownership and housing wealth in Australia is a major reason for this.
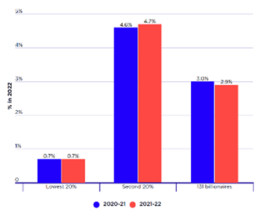
Share of all wealth held by 131 billionaires compared with low-wealth groups (%)
The 131 billionaires comprised 0.001% of the population yet held 2.9% of all household wealth in 2021, a decline from 3% in 2020.
This graph shows that they held more wealth among them than the lower 20% of households ranked by wealth (who held 0.7% of all wealth) and somewhat less than the second-lowest 20% (with 4.7%). This suggests that 131 individuals held almost as much wealth between them as the 2.8 million households in the lowest 30% ranked by wealth.
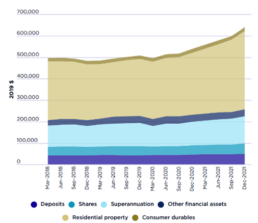
Household wealth per capita (2019 dollars)
While the COVID recession in March 2020 at first reduced household wealth through declines in share and housing prices, a combination of lockdowns, public income support, and low interest rates dramatically lifted household saving and wealth from mid-2020 through to December 2021. The largest contributor to this increase in wealth was a sharp rise in housing prices, as shown on this graph.


