
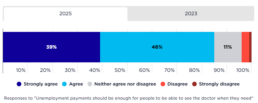
Community attitudes towards "unemployment payments should be enough for people to be able to see the doctor when they need"
This chart shows the responses in our Community attitudes towards poverty and inequality survey to the idea that Unemployment payments should be enough for people to be able to see the doctor when they need. [infogram id="_/z5PZu9Wtow7tLXRJQp3h" prefix="pg8" format="interactive" title="Unemployment payments should be enough to see the doctor_2025 and 2023"] In 2025, 85% of people in Australia agreed that unemployment payments should be enough for people to be able to see the doctor when they need. In 2023, 84% of people in Australia agreed that unemployment payments should be enough for people to be able to see the doctor when they need.
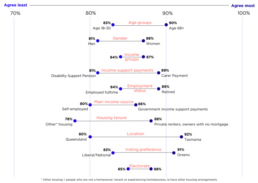
Demographic distribution of community attitudes towards "unemployment payments should be enough for people to be able to see the doctor when they need"
This chart shows the demographic responses in our Community attitudes towards poverty and inequality survey to the idea that Unemployment payments should be enough for people to be able to see the doctor when they need. [infogram id="_/59LqrRsvnhtug2rPz1Ro" prefix="Cbo" format="interactive" title="Fig30_Payments enough to see the doctor_2026 demographic"] By age: People aged 68 and above agreed most (90%) and people aged 18 to 30 agreed least (83%). By gender: More women agreed with this statement (88%) than men (81%). By income: Differences in agreement by income level were small (84–87%). By income support payment: People in the lowest income quintile that were receiving carer payments agreed most (89%) and people receiving disability payments agreed least (81%). By employment status: People who had retired agreed most (89%) and people employed full-time agreed least (84%). By income source: People receiving government income support payments agreed most (86%) and people who were…

Mental health conditions by weekly equivalised household income
[infogram id="_/jRvHCtq6TGSe4X14K84P" prefix="9Vi" format="interactive" title="MBC by income"] Those with lower weekly household incomes report higher levels of mental health conditions.

Heart, stroke and vascular diseases, diabetes and arthritis by main income source
[infogram id="_/wtbsgLuNV5qSOlWHk9kx" prefix="WbC" format="interactive" title="Chronic conditions 1_heart+diabetes, arthritis by income source"] Those receiving government pensions/allowances and aged under 65 reported higher levels of heart, stroke and vascular diseases, diabetes and arthritis than those whose main income was wages or salary.

Heart, stroke and vascular diseases, diabetes and arthritis by SEIFA
[infogram id="_/gSZZO9tnuaw2sVa8EkI8" prefix="KTY" format="interactive" title="Chronic conditions 1_heart+diabetes_ arthritis by SEIFA"] Those within lower socio economic indexes for areas reported higher levels of Heart, stroke and vascular diseases, diabetes and arthritis than those in higher socio economic indexes for areas (SEIFA). To find out more about SEIFA, go to https://www.abs.gov.au/websitedbs/censushome.nsf/home/seifa

Heart, stroke and vascular diseases, diabetes and arthritis and diabetes by labour force status group
[infogram id="_/YUaSf21iH9bpAPo5bMS0" prefix="sp8" format="interactive" title="Copy: Chronic conditions 1_asthma + heart + diabetes_by LFS"] Those not in the labour force, aged either above or below 65, report higher levels of heart, stroke and vascular diseases, diabetes and arthritis than those working part or full time.

Heart, stroke and vascular diseases, diabetes and arthritis by income group
[infogram id="_/v7BFxL4YM34SEVspGB4b" prefix="9EG" format="interactive" title="Chronic conditions 1_heart+diabetes+arthritis_ by income"] Those in lower income groups report higher levels of heart, stroke and vascular diseases, diabetes and arthritis than those in higher income groups.

Premature deaths - male and female, by socioeconomic status
[infogram id="_/sSgCzWH22BKL2qfQI7G8" prefix="A2h" format="interactive" title="Premature deaths - male and female by socioeconomic status"]