Trends in poverty gaps among older people
This graph shows that the average poverty gaps (the difference between the average incomes of those below the poverty line and the poverty line) among people aged 65+ in income support households were much lower than those across the whole population between 1999-00 and 2015-16. This is explained by the proximity between pension payments and the poverty line. However, the poverty gap for older couples in income support households rose over the period, from 18% of the after-housing poverty line in 2003-04 to a peak of 29% in 2015-16, probably reflecting increases in housing costs.
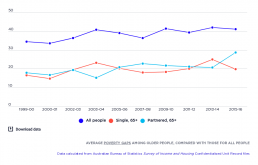
Trends in poverty among older people
This graph compares the before housing poverty rates for single older people after housing costs are taken into account, based on the 50% median income poverty line. It shows that until 2015, single people aged 65+ had significantly higher poverty rates than the wider community, whilst poverty rates for couples aged 65+ have been consistently lower. Poverty rates for older people in income support households (mainly Age Pension recipients) were slightly higher than rates for older single and partnered people generally, and followed similar lines. One of the noticeable features of this graph is the different trend in poverty among older single people and couples between 2005-06 and 2009-10. The poverty rate for older couples was relatively stable, declining from 9.2% in 2005-06 to 8.4% in 2009-10, while poverty rose for single older people from 27% in 2005-06 to 45% in 2008-09, then fell to 18% in 2009-10 – 9 percentage points below the 2005 level. The poverty rate among single older…
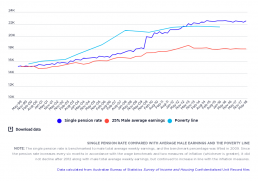
Trends in single pension rate and poverty line
This graph compares the single pension rate with average male earnings and the 50% median income poverty line before housing costs are taken into account. The result of the closeness between these means that large numbers of pension recipients can move from one side of the poverty line to the other.

Average poverty gaps among people in income support households
This graph shows trends in poverty gaps for households in which at least one member receives a substantial income support payment, expressed in constant 2015-16 dollars per week, adjusted for household size. It shows that poverty gaps for households relying on Newstart Allowance rose in several increments over the period, from $81 per week in 1999-00 to $136 per week in 2015-16. Poverty gaps for households relying on Age Pension and Disability Support Pension moved in more narrow fashion. The poverty gap for those relying on Age Pension rose from $52 a week in 1999-00 to $77 a week in 2015-16, while for those relying on Disability Support Pension the gap rose from $59 per week in 1999-00 to $73 per week in 2015-16. The poverty gaps for households relying on Parenting Payment fell from $70 a week in 1999-00 to $67 a week in 2004-05, then increased to $104 in 2015-16. The poverty gap for households on Carer Payment were more changeable, falling from $148 per week in 1999-00 to $28 per…
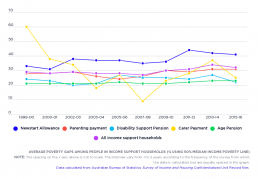
Average poverty gaps among people in income support households by percentage
This graph shows trends in poverty gaps for households in which at least one member receives a substantial income support payment (an income-tested payment for adults such as Newstart Allowance or Age Pension, as distinct from a supplementary payment such as Family Tax Benefit), expressed as a percentage of the 50% median income poverty line. It shows that poverty gaps for households relying on Newstart Allowance rose in several increments over the period, from 33% in 1999-00 to 41% in 2015-16. Poverty gaps for households relying on Age Pension and Disability Support Pension moved in more narrow fashion.

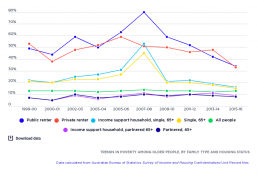
Trends in poverty rates by income support payment
This graph compares poverty rates among households in which at least one member receives a substantial income support payment (an income-tested payment for adults such as Newstart Allowance or Age Pension, as distinct from a supplementary payment such as Family Tax Benefit). Poverty rates for those receiving Newstart Allowance and Parenting Payment were consistently above the average, whilst the poverty rate for the Age Pension was consistently below average. The difference in poverty rates between these payments has increased since the Global Financial Crisis of 2007-08. Poverty in income support households reliant on Newstart Alllowance declined from 61% in 1999-00 to 48% in 2003, and then rose in zigzag fashion to 78% in 2015-16. Among income support households reliant on most pension payments (Age Pension, Disability Support Pension and Carer Payment), poverty rose during 2003-07; declined sharply from 2007-09; and has continued to fall since then. For households reliant on…
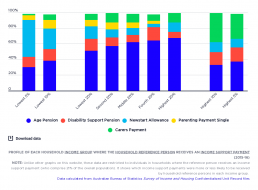
Profile of each household income group by income support status
Unlike most other graphs in this website, this one is limited to the 21% of people (including children) living in households where the reference person (usually the highest income-earner) receives an income support payment. Its purpose is to compare the types of income support payments received in low, middle and high household income groups. Among people towards the lower end of the income scale, there is an increasing proportion of households where the reference person receives Newstart Allowance People in households whose reference person receives Newstart Allowance comprise 16% of the lowest 20% income group; 30% of the lowest 10% income group; and 47% of the lowest 5% income group. The reasons for the greater concentration of people in households receiving Newstart Allowance in the lowest income groups are that Newstart is the lowest, and most strictly income-tested, of these income support payments. On the other hand, a slight majority (51%) of people in the lowest 20% income…
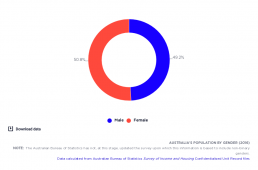
Australia’s population by gender
Those identifying as female comprise 51% of the population, while those identifying as male comprise 49% of the population.
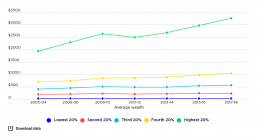
Trends in average wealth by wealth group
This chart shows the real value (after inflation is taken into account) of average wealth holdings of each wealth group, compared over time. As with income inequality, changes in wealth inequality were driven mainly by the highest 20% wealth group, although this growth was more volatile than for middle and low wealth groups. This was due in part to the greater share of the wealth of the highest 20% held in financial assets such as shares. The average household wealth of the highest 20% rose from $1.9 million in 2003-04 to $2.6 million in 2009-10, declined to $2.4 million in 2011-12 and rose again to $3.255 million in 2017-18.

Increase in average wealth by wealth group
This graph compares the increase in real value (after inflation is taken into account) of average wealth holdings of each wealth group. Between 2003-04 and 2017-18: The average wealth of the highest 20% wealth group rose by 68%. The average wealth of the middle 20% wealth group rose by 36% The average wealth of the lowest 20% wealth group rose by 6%.