
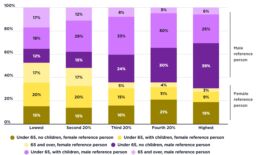
Profile of each income group by gender of household reference person
Families with a female reference person generally have lower incomes than those with a male reference person. The two charts below show the profile of each income group by the gender of the household reference person. 2019-20 This chart shows that a clear majority (70%) of households in the highest 20% income group had a male reference person. [infogram id="_/Alq5YB73P2Whm2EmQe7l" prefix="daw" format="interactive" title="2024_Fig4_Income profile by gender"] 2017-18 This chart shows that the majority (71%) of households in the highest 20% income group had a male reference person. [infogram id="_/VjPVJdwCFm48s4OZSlUi" prefix="U1K" format="interactive" title="2019-20_Fig4_Income profile by gender"]
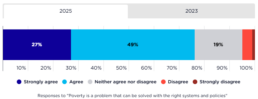
Community attitudes towards "poverty is a problem that can be solved with the right systems and policies"
This chart shows the responses in our Community attitudes towards poverty and inequality surveys to the idea that Poverty is a problem that can be solved. [infogram id="_/mNcbNl44oSEvjjeQgZAF" prefix="OFN" format="interactive" title="Poverty can be solved with the right systems and policies_2023 and 2025"] 2025: It shows that 76% of people in Australia agreed that poverty is a problem that can be solved with the right systems and policies 2023: It shows that 75% of people in Australia agreed that poverty is a problem that can be solved with the right systems and policies.
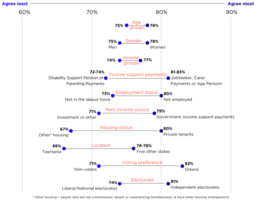
Demographic distribution of community attitudes towards "poverty is a problem that can be solved with the right systems and policies"
This chart shows the demographic distribution of responses in our Community attitudes towards poverty and inequality surveys to the phrase Poverty is a problem that can be solved with the right systems and policies. By age: Agreement was largely consistent across age groups (75–78%). By gender: Women (78%) and men (74%) had similar levels of agreement. By income: Differences by income quintile were small (74–77%). By income support payment: People in the lowest income quintile who received JobSeeker, carer, or age pension payments agreed more (81–83%) than those who were receiving disability or parenting payments (72–74%). By employment status: People who were not employed agreed most (80%) and people who were not in the labour force agreed least (73%). By income type: People receiving government income support payments agreed most (79%) and people with investment or other main income sources agreed least (71%). By housing tenure: Tenants in private housing agreed…
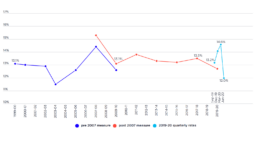
Comparison of poverty trend and SDG target path
This chart shows the percentage of people in poverty between 1999-20 to 2019-20 and compares this with the percentage of people in poverty if we were following the target set out in the UN Sustainable Development Goals, of which Australia is a signatory. The Sustainable Development Goal on poverty includes: "By 2030, reduce at least by half the proportion of men, women and children of all ages living in poverty in all its dimensions according to national definitions" (note that this chart uses 50% of median income in lieu of an accepted national definition of poverty in Australia).
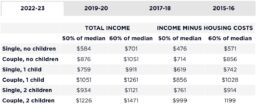
Poverty lines by family type
This table shows poverty lines by family type in dollars per week, including social security payments. This shows relative poverty in Australia using poverty lines of 50% and 60% of national median household income. More information on the definitions of poverty and different ways of measuring poverty can be found on our poverty page and our FAQ page. It also shows the poverty lines before and after housing costs are taken into account (known as before and after housing costs; or as total income and income minus housing costs). Housing costs vary considerably among households, depending on whether those households are owners, purchasers or tenants and what part of Australia those households live in. In order to take into account the varying costs of housing, a separate set of ‘after housing costs’ (or 'income minus housing costs') poverty lines is used. This set is created by removing housing costs from disposable income before calculating the median income. This is a measure of the…
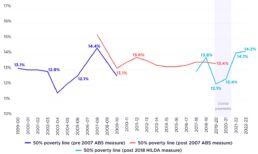
Percentage of all people in poverty from 1999 - 2023
This figure shows the percentage of all people in poverty from 1999-00 to 2022-23. It shows how the rate of poverty declined from 13.4% in 2017-19 to 12.1% in 2019-20, then rose to 12.4% in 2020-21, and even further to 14.1% in 2021-22. The poverty line used is 50% of median income, taking account of housing costs. The lower (dark blue) line shows poverty rates measured using the pre-2007 ABS income definition, while the higher (red) line is based on the post 2007 income definition; the data shown is from the ABS Survey of Income and Housing. The light blue line shows poverty as measured using the Household Income and Labour Dynamics in Australia (HILDA) survey from the Melbourne Institute.'

Average wealth per adult in 2020
[infogram id="_/mIjUrZvfD3DxGdqIblfo" prefix="qwb" format="interactive" title="Average wealth per adult in 2020 ($AUS)"] According to Credit Suisse’s Global Wealth Report, the average wealth of Australian households was $628,000 per adult in 2020, the fourth highest in the world behind Switzerland, the United States and Hong Kong (North America as shown on the graph refers to the region, as does Asia-Pacific and Europe).

Average wealth of households by age, as a percentage of the average wealth of all (%)
[infogram id="_/ttwWUYDlFm7cWHBFhax4" prefix="Gs2" format="interactive" title="Average wealth of households by age as a percentage of average wealth of all"] This graph shows that wealth inequality has increased across generations since 2003, especially in the distribution of owner-occupied housing. As a proportion of the average value of owner-occupied homes held across all age groups: • The average value held in households with a reference person under 35 years fell from 31% in 2003 to 26% in 2021; • That of those aged 35-44 years fell from 82% in 2003 to 69%; • That of those aged 64 years rose from 140% in 2003 to 144%.

Share of wealth held by households ranked by wealth (% in 2021)
[infogram id="_/Z0Lk9pDwDOTPqlwO2Tma" prefix="pyR" format="interactive" title="Share of wealth held by households ranked by wealth"] Consistent with the findings of our Inequality in Australia 2020 report, wealth is still very unequally distributed in 2021-22. The highest 10% of households by wealth has an average of $6.1 million or 46% of all wealth. The next 30% have an average of $1.7 million or 38% of all wealth. That leaves the majority – the lower 60% - with $376,000 or just 17% of all wealth.