
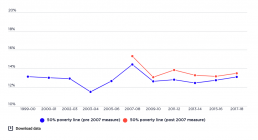
Trends in poverty, all people, 1999-00 to 2017-18
[infogram id="_/ypSowuzIsLYD4473YkFl" prefix="Qaz" format="interactive" title="Percentage of all people in poverty from 1999 - 2017"] This graph shows the poverty rates, after housing costs have been deducted, as a percentage of all people from 1999-00 to 2017-18. Whilst we focus on the consistent estimates based on the pre-2007 measure by the ABS (lower line), this graph also includes the higher poverty rates derived from the 2007-08 ABS income measure (upper line). The graph shows how the overall poverty rate fluctuated within a band between 11.5% and 14.5% between 1999-00 and 2017-18. Poverty declined substantially from 13.1% in 1999 to 11.5% in 2003, rose sharply during the boom years to 14.4% just before the Global Financial Crisis (GFC) in 2007, declined to 12.6% in 2009, and since then has risen modestly to 13.1% in 2017-18.
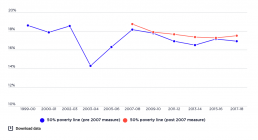
Trends in poverty - children, 1999-00 to 2017-18
[infogram id="_/B9ifB7d9gPDfd9ow2T4i" prefix="qAf" format="interactive" title="Percentage of all children in poverty from 1999-2017"] This graph shows the poverty rate amongst children, after housing costs have been deducted, as a percentage of all children. It shows that poverty among children (people aged under 15 years) has moved within a higher band than overall poverty, fluctuating between 14.3% and 18.6% from 1999-00 to 2017-18. Before the Global Financial Crisis (GFC) in 2007, it followed a similar path to the overall poverty rate, declining substantially from 18.6% in 1999-00 to 14.3% in 2003-04, and rising sharply between from 2003-04 to 18.1% in 2001-02. After the GFC, however, the path of child poverty diverged from that of overall poverty. It fell only slightly to 17.8% in 2009-10, declined further to 16.5% in 2013-14, then rose to 16.9% in 2017-18
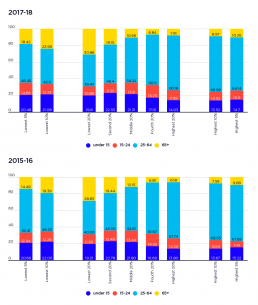
Profile of each income group by age
This graph shows the make-up of each income group by age. [infogram id="_/eDbRF9QdpI3mCfj46LMV" prefix="Fyc" format="interactive" title="2023-fig2_Profile of each income group by age"] 2019-20: The largest age-group in every income group are 25-64 year olds, as they have a greater share of the population as a whole. However, the lowest income group comprises almost a third of older people, while they comprise only 8% of the highest income group. 2017-18: The largest age-group in every income group are 25-64 year olds, reflecting their greater share of the overall population. However, older individuals are over-represented (66%) in the lowest 40% income group, as are children aged under 15 (45%). Almost half (48%) of people of working age, 25-64 years, were in the highest 40% income group, reflecting that age group’s larger size and greater earning capacity. 2015-16: The largest age-group in every income group are 25-64 year olds. However, older individuals are over-represented (29%)…