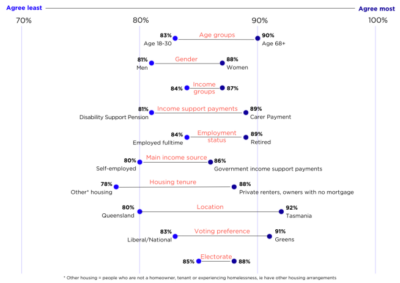
This chart shows the demographic distribution of responses in our Community attitudes towards poverty and inequality surveys to the phrase Poverty is a problem that can be solved with the right systems and policies.
- By age: Agreement was largely consistent across age groups (75–78%).
- By gender: Women (78%) and men (74%) had similar levels of agreement.
- By income: Differences by income quintile were small (74–77%).
- By income support payment: People in the lowest income quintile who received JobSeeker, carer, or age pension payments agreed more (81–83%) than those who were receiving disability or parenting payments (72–74%).
- By employment status: People who were not employed agreed most (80%) and people who were not in the labour force agreed least (73%).
- By income type: People receiving government income support payments agreed most (79%) and people with investment or other main income sources agreed least (71%).
- By housing tenure: Tenants in private housing agreed most (80%) and people who were not a homeowner, tenant, or homeless (i.e., had ‘other’ housing arrangements) agreed least (67%).
- By location: People from Tasmania agreed less (66%) than people from the five other states (76–78%).
- By voting preference: People who voted Greens agreed most (83%) and people who did not vote agreed least (71%).
- By electorate: People in electorates held by independent politicians agreed most (81%) and those in electorates held by Liberal/National politicians agreed least (74%).