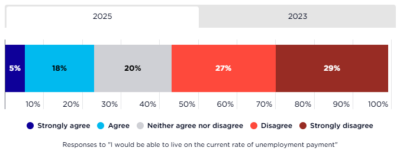
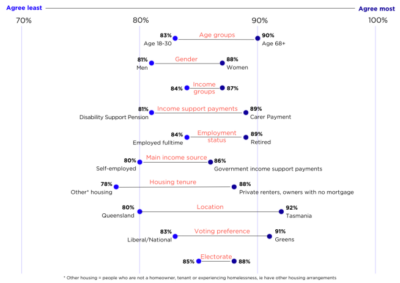
This chart shows the demographic responses in our Community attitudes towards poverty and inequality survey to the question whether respondents would be able to live on the current rate of unemployment payment (in the 2025 survey, this was $56 a day).
[infogram id=”_/quiECN3Sts7qbbWcWGNe” prefix=”FpD” format=”interactive” title=”Fig32_Would be able to live on current rate of JobSeeker_demographic groups 2026″]
- By age: People aged 51 to 67 disagreed most (61%) and people aged 68 and above disagreed least (50%).
- By gender: More women disagreed with this statement (59%) than men (54%).
- By income: People with the second highest income (Quintile 4) disagreed most (60%) and people with the second lowest income (Quintile 2) disagreed least (50%).
- By income support payment: People in the lowest income quintile who were receiving JobSeeker payments disagreed most with this statement (67%) and people receiving age pension disagreed least (46%).
- By employment status: People who were not in the labour force disagreed most (59%) and people who had retired disagreed least (52%).
- By income source: People who were receiving government income support payments or wages disagreed most (58%) and people with investment or other income sources disagreed least (50%).
- By housing tenure: Private rental tenants disagreed most (66%) and homeowners without a mortgage disagreed least (49%).
- By location: Victorians disagreed most (60%) and South Australians disagreed least (50%).
- By voting preference: People who voted Greens disagreed most (77%) and people who voted Liberal/National or Independent disagreed least (47%).
- By electorate: Differences in agreement by party affiliation of elected parliamentary representative were very small (56–57%)