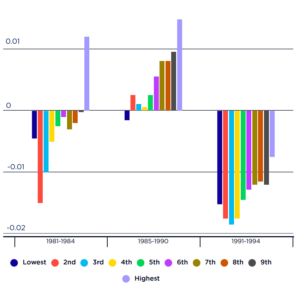
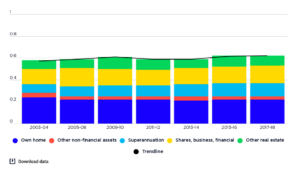
This shows changes in the shares of overall household wealth held by each wealth group.
[infogram id=”_/JNFGRm7KnztFQIFqH9Rm” prefix=”7hv” format=”interactive” title=”2017-18: Fig.23_Change in shares of overall wealth by wealth group, from 2003-04 to 2017-18 (%)”]
Between 2003-04 and 2017-18, the highest 20% wealth group increased its share of overall wealth by 4.5%, while the share of all other groups declined. This represents an unambiguous increase in wealth inequality over the period.