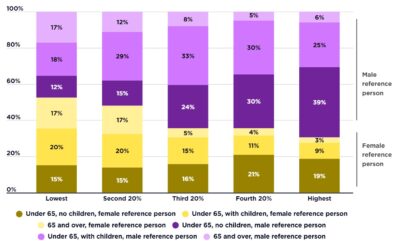
This graph shows the profile of households in poverty by the disability status of the main reference person.
2017-18
[infogram id=”_/AgvpU1SCmc1s9ts5RPz8″ prefix=”FXm” format=”interactive” title=”2017-18: Fig.21_Profile of poverty by disability status (% of adults in poverty)”]This shows that 37% of people in poverty have disability using the 50% of median income poverty line; and 39% using the 60% median income poverty line.
2015-16
[infogram id=”_/109miWknhgg8B2mQkyos” prefix=”KGl” format=”interactive” title=”Fig.21_Profile of poverty by disability status (% of adults in poverty)”]This shows that 38% of people in poverty have disability using the 50% of median income poverty line; and 41% using the 60% median income poverty line. This reflects a combination of the overall rate of disability (18% of the total population in 2015), the higher rate of disability among people aged 65 and over, and the average risk of poverty among people with disability.