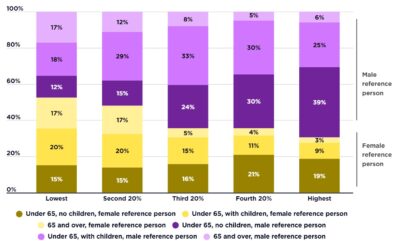
These graphs display the number of people already living in poverty, divided into household groups by 50% median income and 60% median income poverty lines, firstly in 2017-18 and then in 2015-16.
2017-18
[infogram id=”_/bU3Xqx2iIXws06rmmbbS” prefix=”Vqk” format=”interactive” title=”Profile of poverty by family type (% of households in poverty), 50% median income poverty line”]This shows that couple households with children, due to their larger share of the overall population, are the largest group in poverty, at 33.9% using the 50% of median income poverty line and 33.7% using the 60% of median income poverty line. Sole parent families are strongly over-represented among those in poverty, at 18% using the 50% median income poverty line and 15.5% using the 60% median income poverty line.
2015-16
[infogram id=”_/XcDde09uFSnHzssH7R3n” prefix=”Be2″ format=”interactive” title=”Fig.12_Profile of poverty by family type (% of households in poverty)”]This shows that couple households with children, due to their larger share of the overall population, were the largest group in poverty, at 42% using the 50% of median income poverty line and 41% using the 60% of median income poverty line. Sole parent families were strongly over-represented among those in poverty, at 20% using the 50% median income poverty line and 17% using the 60% median income poverty line, compared with the 7% of all people who lived in sole parent families.