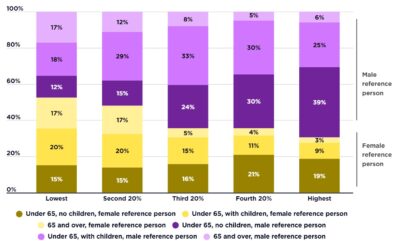
These graphs show the profile of households in poverty by the labour force status of the household reference person.
2017-18 (All people)
[infogram id=”_/KOubd9U9MDbUTowEXixj” prefix=”mbP” format=”interactive” title=”_Profile of poverty by labour force status, 50% median income poverty line, all people”]
Although households that rely on paid employment have a much lower rate of poverty, they make up 38% of all people below the 50% median income poverty line, and 42% of all people below the 60% median income poverty line.
2017-18 (Employed fulltime)
[infogram id=”_/fkwaVnPAqgnJAv3Nh4v3″ prefix=”XgN” format=”interactive” title=”Profile of poverty by labour force status, fulltime, 50% median income poverty line”]
2017-18 (Employed parttime)
[infogram id=”_/vDCYZt8Dp01ntEpyaiZ7″ prefix=”J1v” format=”interactive” title=”Profile of poverty by labour force status, part time, 50% median income poverty line”]
2015-16
[infogram id=”_/je9xnvNL1iAu8dEAhCHV” prefix=”aKi” format=”interactive” title=”Fig.19_ Profile of poverty by labour force status of household reference person”]Although households that rely on paid employment have a much lower rate of poverty, they make up 39% of all people below the 50% median income poverty line, and 41% of all people below the 60% median income poverty line. This reflects the fact that three times as many people live in households whose reference person receives income from employment compared with income support payments.