
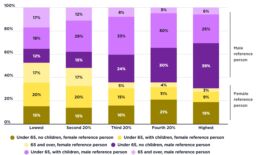
Profile of each income group by gender of household reference person
Families with a female reference person generally have lower incomes than those with a male reference person. The two charts below show the profile of each income group by the gender of the household reference person. 2019-20 This chart shows that a clear majority (70%) of households in the highest 20% income group had a male reference person. [infogram id="_/Alq5YB73P2Whm2EmQe7l" prefix="daw" format="interactive" title="2024_Fig4_Income profile by gender"] 2017-18 This chart shows that the majority (71%) of households in the highest 20% income group had a male reference person. [infogram id="_/VjPVJdwCFm48s4OZSlUi" prefix="U1K" format="interactive" title="2019-20_Fig4_Income profile by gender"]
Community attitudes towards "Incomes at the top are too high"
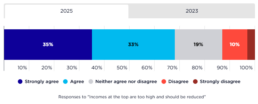
This chart shows the responses in our Community attitudes towards poverty and inequality survey to the phrase incomes at the top are too high. In 2025, 68% of people in Australia agreed that the incomes of those with the most are too high. In 2023, 63% of people in Australia agreed that the incomes of those with the most are too high and should be reduced. Note: Question wording in 2023 survey was incomes at the top are too high and should be reduced and in the 2025 survey was incomes at the top are too high
Demographic distribution of community attitudes towards "Incomes at the top are too high"
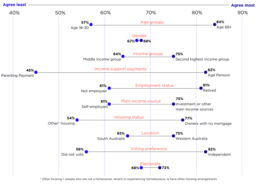
This chart shows the demographic distribution of responses in our Community attitudes towards poverty and inequality survey to the phrase incomes at the top are too high. By age: Agreement increased markedly by age group, from 57% (aged 18 to 30) to 84% (aged 68 and above). By gender: Agreement was largely consistent between women (67%) and men (68%). By income: Differences varied when compared by income, with people in the second income quintile agreeing most (75%) and people in the third (middle) income quintile agreeing least (64%). By income support payment: People in the lowest income quintile who were receiving the age pension agreed most (82%), compared with those receiving parenting payments (45%), or carer, JobSeeker and disability payments (58–72%). By employment status: People who had retired agreed most (81%) and people who were not employed agreed least (61%). By income source: People who had investment or other main income sources agreed most (75%) and people…
Community attitudes towards "incomes at the bottom are too low"
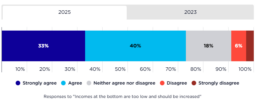
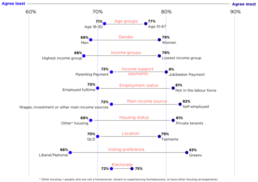
This chart shows the responses in our Community attitudes towards poverty and inequality survey to the concept of whether incomes at the bottom are too low. In 2025, 73% of people in Australia agreed that incomes at the bottom are too low and should be increased. In 2023, 76% of people in Australia agreed that incomes at the bottom are too low and should be increased. *Note: Question wording in the 2023 survey was Incomes at the bottom are too low and should be increased
Demographic distribution of community attitudes towards "incomes at the bottom are too low"
This chart shows the responses in our Community attitudes towards poverty and inequality survey to the concept of whether incomes at the bottom are too low. By age: People aged 51 to 67 agreed most (77%) and people aged 18 to 30 agreed least (71%). By gender: More women agreed with this statement (79%) than men (69%). By income: People in the lowest income quintile agreed most (79%) and people in the highest income quintile agreed least (68%). By income support payment: People in the lowest income quintile who were receiving JobSeeker agreed most (80%) and people receiving parenting payments agreed least (72%). By employment status: People who were not in the labour force agreed most with this statement (81%) and people who were employed full-time agreed least (70%). By income source: People who were self-employed agreed most (82%) and people receiving wages or with investment or other main income sources agreed least (72%). By housing tenure: Tenants in private housing agreed…
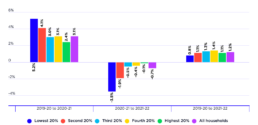
Average annual change in disposable income during COVID-19
This chart shows how income inequality declined sharply in year one of the Covid recovery (2020-21) but was restored to its previous level in year two (2021-22). [infogram id="_/GVjE476awTwerirKWLuM" prefix="4FW" format="interactive" title="2023 Average annual change in disposable income lockdowns and recovery"] It shows that, in year one (2020-21), inequality declined. The average income of the lowest 20% grew by 5.2% after inflation, compared with 3% for the middle 20% and 2.4% for the highest 20%. In year two (2021-22) this pattern was reversed. The average income of the lowest 20% fell by 3.5%, compared with a fall of 0.5% for the middle 20% and a fall of 0.1% for the highest 20%. When we compare average growth in incomes for the two-year recovery period from 2019-20 to 2021-22, these effects largely cancel each other out leaving little change in income inequality overall. The income of the lowest 20% grew by an average of 0.8% per year, compared with 1.3% per year for the middle…
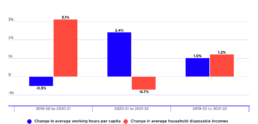
Average changes in hours worked and household incomes during COVID-19
This chart shows the changes in incomes and work hours during first years of the COVID-19 pandemic. [infogram id="_/1dV8AA0plBuj2h9mh8zu" prefix="4Jg" format="interactive" title="2023 average changes in hours worked and household incomes"] It shows that, during ‘year one’ of recovery (2020-21), average household after-tax incomes grew by an extraordinary 3.1% after inflation, much faster than average income growth since the Global Financial Crisis. This occurred despite strict COVID lockdowns and the economic uncertainty surrounding the pandemic, which reduced average paid working hours per capita by 0.5% compared to hours worked in 2019-20. During ‘year two’ (2021-22), these trends were reversed. Average household incomes declined by 0.7% after inflation despite the reduced severity of lockdowns and a solid 2.4% increase in overall paid working hours per capita.

Profile of wealth of each wealth group
[infogram id="_/r8lRWeqz6akat15ZL417" prefix="nHJ" format="interactive" title="Profile of wealth of each wealth group"] There is a significant inequality in wealth between of the highest 10% and the lowest 60% people in Australia. This graph presents the wealth profiles of these groups. Of the wealth of the richest 10% in 2021: • A higher proportion was held in investment property (18%), shares, bonds and trusts (13%), and own-business assets (9%), compared with 8%, 3% and 2% respectively for the middle 30%; • A lower proportion was held in their homes (32%), superannuation (19%), deposits (5%), and durables (4%), compared with 50%, 21% and 9% respectively for the middle 30%. Of the wealth of the lower 60% in 2021: • Higher proportions were held in superannuation (23%), durables (17%) and deposits (8%), compared with 21%, 9% and 7% respectively for the middle 30%; • A similar proportion was held in their homes (48% compared with 50%, taking account of people who were not…
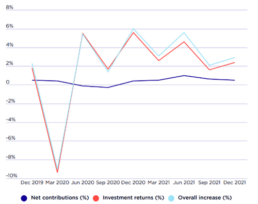
Cumulative growth in superannuation assets
[infogram id="_/0tz7xV9CUSBEcPcLQadu" prefix="IdH" format="interactive" title="Cumulative growth in superannuation assets"] Superannuation account balances vary over time through a combination of net contributions (contributions minus any benefit payments) and investment returns. Since most superannuation funds invest in a combination of shares, bonds, property and cash deposits, their average investment returns broadly reflect returns on those investments. As a proportion of their value in December 2019, superannuation account balances declined by 9% by March 2020 then rose to 18% above December 2019 levels by December 2021.
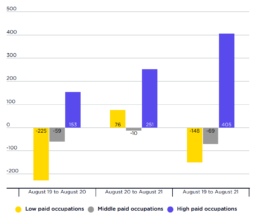
Change in number of workers employed by occupation (000s)
[infogram id="_/bBqJUhZjbY5hn57ajml8" prefix="2Db" format="interactive" title="Figure 7_changes in employment by pay level"] This graph shows that, from August 2020 to August 2021 (centre bars): * The number of people employed in lower-paid occupations rose by 71,000; * The number in middle-paid occupations fell by 5,000; * The number in higher-paid occupations rose by 251,000.