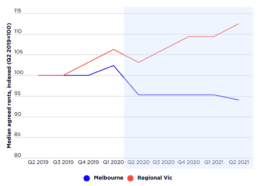
Median agreed rents, indexed - NSW & Victoria 2019-2021
These detailed two-year trends for NSW and Victoria relate to agreed rents. Notably, Sydney’s outer suburban trend sharply contrasts from that of inner and middle ring localities. Rents in outer Sydney have been tracking along a trajectory much more similar to regional NSW (other than Newcastle). It could be that this is partly a reflection of changing property type demand during the pandemic. If homes for let in inner and middle Sydney are typically units, but most in outer ring suburbs (as in most regional areas) are houses, that could affect aggregate rent trends in a period when house rentals have commanded an unusually large premium.
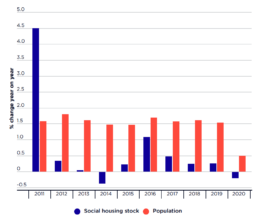
Annual growth rates – social housing stock and population, 2011-2020
For most of the 2010s population growth has run at more than three times the level of social housing expansion. The first year in this sequence reflects the extraordinary impact of the national Social Housing Initiative (KPMG 2012). Launched in 2009 to counter the Global Financial Crisis, this four-year stimulus investment program represents the only significant addition to the social housing stock of the past 25 years. Across the last decade, however, Australia’s population grew by 16% whereas – even with 2010 as the base year – social housing expanded by only 7%. In the second half of the 2010s population growth outstripped social housing growth more than threefold – 7% versus 2%. Similarly, in every year from 2012 onwards, much faster growth in population than in social housing stock meant that the ratio of the former to the latter continued to grow. This was true even in 2020 when population growth was unusually depressed due to the pandemic, but when social housing stock…
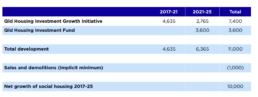
Interpretation of Queensland Government published statistics on social housing construction (dwelling commencements)
On 17 June 2021 the Queensland Government announced a $2.9 billion housing stimulus investment program. This supplements a pre-existing financial commitment to the Government’s 2021-2025 Housing and Homelessness Action Plan. The 2021 funding package involves three separate programs: $1.74 billion under the Queensland Housing Investment Growth Initiative (QHIGI) to expand social housing across the state by 2,765 dwellings, substantially involving schemes already planned and designed. Implicitly, this involves capital grants (averaging $629k per dwelling) to community housing organisations (and possibly other providers). A $1 billion investment fund (Queensland Housing Investment Fund – QHIF) to generate annual returns estimated at $40 million, implicitly to be channelled into ongoing revenue subsidies to participating housing developer-managers over a number of years. This model appears similar to the NSW Social and Affordable Housing Fund, and also the Victorian Social Housing…
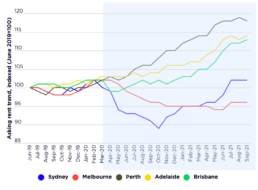
Asking rents for houses and apartments, 2019 - 2021
The differential economic impacts of the COVID-19 pandemic across Australia are apparent in 2020-21 rent trends for the five main capital cities. Unlike the other cities, Sydney and Melbourne saw significant reductions in asking rents during 2020 in relation to both houses and apartments. Only by mid-2021 had Sydney house rents recovered to their pre-crisis level. House rents in Melbourne remained almost 5% below their March 2020 values at this time, while apartment rents in both cities were still well over 5% lower than their pre-COVID levels.
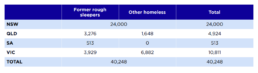
Emergency accommodation placements – flow 15 March-30 September 2020 (persons)
Considering the particular concerns about people experiencing street homelessness – especially the ‘chronic rough sleeper’ component of this cohort – there is a special interest in estimating the numbers of rough sleepers assisted via 2020-2021 EA programs. Former rough sleepers assisted by the Queensland, South Australian and Victorian governments totalled 7,718, as shown in this table. Unfortunately, no equivalent figure was provided by the NSW Government, although it has been officially reported that 4,355 former rough sleepers had been assisted via EA in the period April 2020-January 2021 (NSW Audit Office 2021 p3). These figures suggest that, by early 2021, at least 12,073 (7,718 + 4,355) rough sleepers had benefited from EA programs (of whom 8,284 were in NSW and Victoria). Particularly within the context of the ABS estimate of 8,200 rough sleepers nationally on Census night 2016 (ABS 2018), these are notable figures.
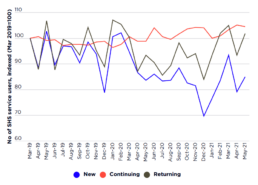
Trend in Specialist Homelessness Service (SHS) user cohorts, Aug 2017-Apr 2021
A new analysis of SHS service user data is presented iin this graph. This analysis, enabled with the kind assistance of the Australian Institute for Health and Welfare (AIHW), differentiates service users in any given month on the following basis: new service user – person receiving services in a given month for the first time (since the current system was established in 2011) continuing service user – person receiving services in a given month and already receiving services in the previous month returning service user – person receiving services in the current month and in an earlier month (since 2011) but not in the previous month. To indicate the relative size of these cohorts, in January 2021, around 87,600 people received SHS services, of whom 76% were continuing clients, 14% returning clients and 10% new service users. Classified as such, this new breakdown arguably provides a more meaningful insight into homelessness trends during the pandemic than the standard data…
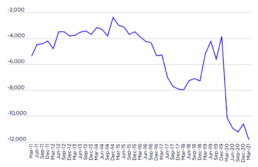
Quarterly net internal migration, greater capital cities combined, March 2011 to March 2021
The increased flexibility of working arrangements is also believed to be a strong factor prompting the quantifiable spike in out-migration from capital cities seen in 2020 and 2021. At the same time, as recently highlighted by the Regional Australia Institute (2021), the COVID-19 crisis appears to have caused a marked drop in migration from regional areas to capital cities – down by 11% in 2020 compared with the previous year. Thus ‘regional people have been staying in place in regions in far great numbers’ (ibid p.14). A decline in the flow of people departing to state capitals is likely to have impacted on housing markets to the extent that fewer dwellings will have been coming up for sale or rent. It should be noted that while this figure is presented as including all capital cities, the underlying ABS data show that recent outmigration has been, in fact, entirely confined to Sydney and Melbourne. The relatively limited scale of the movement recorded must also be borne in……
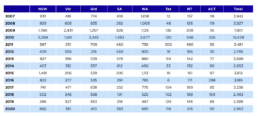
Social housing commencements by jurisdiction, 2007-2020
A key factor affecting the changing scale of social housing provision is new housing construction. This table shows that the years 2009 and 2010 were exceptional, due to the Social Housing Initiative. More recently, new building commencements have oscillated around 3,000 units – or around 1.5% of all housebuilding. This compares with 16% of all residential construction commissioned by state governments in the period 1945-70. Maintaining social housing representation in the national housing portfolio – some 4.2% of occupied dwellings in 2018 – would require a construction share at least at this level. Failure to build at this rate means a continuation of the trend ongoing since the 1990s, whereby social housing continues to decline in these terms (from 6.3% in 1991).
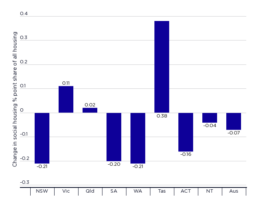
Projected change in social housing proportionate share of all housing, 2021-22 - 2023-24
This graph shows the expected change in social housing as a proportion of all housing between 2021-22 and 2023-24. In jurisdictions such as South Australia, ACT and the Northern Territory which have pledged little or no post-COVID social housing construction stimulus, planned activity is largely focused on replacing rundown public housing, meaning that new development gains will be largely offset by demolition losses. The same is true for NSW. Thus, across Australia, and allowing for both demolitions and sales, we project the net addition to social housing provision over the next three years as around 15,500 dwellings. Victoria and Queensland will be responsible for more than 60% of Australia’s social housing construction (and 80% of the net increase in provision) in this period. The scale of planned development in Victoria, Queensland and Tasmania, will (at least temporarily) reverse historically declining proportionate representation of social housing in these states. Nevertheless,…
Eviction proceedings
This table shows the South Australian Civil and Administrative Tribunal data on landlords’ applications for eviction from Q4 2019 to Q4 2020. It shows that landlords’ eviction applications did indeed dip after the eviction moratorium commenced near the start of Q2 2020, and were down 33% year-on-year in Q4 2020. Nevertheless, over 3,000 tenancies were subject to termination proceedings during the moratorium that year.