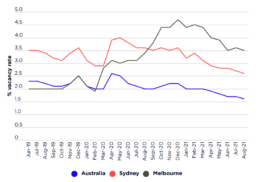
Private rental vacancy rates, Australia, Sydney & Melbourne, June 2019 to August 2021
The economic shock associated with the 2020 national lockdown, and resulting reduced demand for rental property, is clearly apparent this graph. However, the impact was larger and more sustained in Sydney and – especially – Melbourne than in Australia as a whole. In these cities this could also have reflected ongoing additions to supply due to the tail end of the 2010s apartment construction boom. The scale of the 2020 vacancy rate increase in Melbourne is the most striking feature of this figure. Notably, this involved a rise of some 18,000 vacant dwellings between March and December – exactly coincident with the reduced number of Melbourne tenancies recorded during this period, as reported in the previous section. Unfortunately, Sydney and Melbourne cannot be excluded from the ‘Australia’ figures in the above graph. If this were possible it would likely show only a very small ‘vacancy rate pandemic impact’ beyond the boundaries of the nation’s two largest cities.
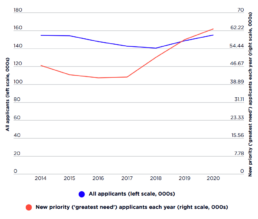
Eligible social housing applicants awaiting tenancy allocation, Australia, 2014-2020
Difficulties encountered by state governments in rehousing homeless people from emergency hotel placements in 2020 and 2021 are just one recent symptom of an intensifying shortage of social housing that was apparent well before the pandemic. Growing demand pressure in the immediate pre-COVID period is, for example, evident in the rising numbers of priority applicants awaiting a social housing tenancy in recent years. Figure 6.1 Since 2016 this cohort has expanded by 51%. This followed a 30% rise in homelessness in the previous decade (ABS 2018).
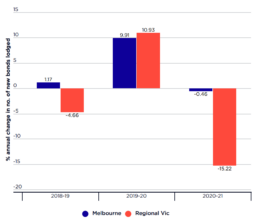
Flow of new tenancies in private rental housing, NSW & Vic, 2019-19 to 2020-21
It is possible to measure flows in the sector, using new bond lodgements to approximate new tenancies commencing, and bond returns to approximate tenancies terminating. Again, pandemic impacts on rental markets once again initially appear fairly contrasting in NSW and Victoria. Importantly, both states saw a marked annual reduction in new bond lodgements in non-metropolitan markets – by 6% in NSW and by 15% in Victoria. Although the geographical classifications used are non-identical there is an apparently major contrast in that Sydney’s inner and middle ring suburbs saw large increases in new bonds lodged and bonds returned – i.e. tenancy turnover – during 2020-21. Across Melbourne as a whole, meanwhile, tenancy turnover in 2020-21 was on the same level as the previous year.
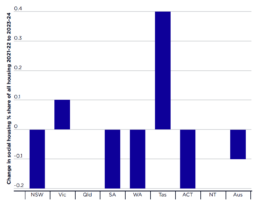
Projected change in social housing proportionate share of all housing, 2021-22 – 2023-24
This graph shows the expected change in social housing as a proportion of all housing between 2021-22 to 2023-24.
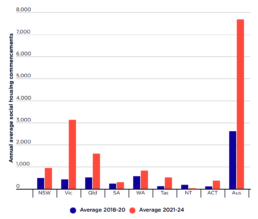
Social housing development activity 2018-20 versus 2021-24
This graph shows the projected national increase in social housing development over the next three years is also in prospect for most jurisdictions. Nevertheless, 61% of all projected commencements over the period will be in just two states, Victoria and Queensland. Despite being the nation’s largest state, NSW will make only a very modest contribution to the Australia-wide total. However, ignoring the highly uneven distribution of this activity across the country, the additional social housing construction projected for delivery ‘as a result of the pandemic’ is substantial.
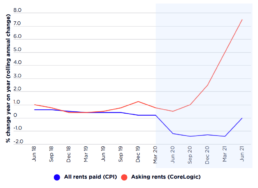
Rent trends, 2018-21, Australia
This graph shows that financial year 2020-21 saw a remarkable divergence in the ‘asking rents’ and CPI ‘all rents’ trajectories. Initially – from March-September 2020 – this divergence appears to have been driven largely by a small temporary decline in the ‘all rents’ trend. This is likely to have reflected the outcome of tenant-landlord negotiations – whether occasioned by a reduction in the tenants’ incomes, or by changed market conditions in the capital cities. From our earlier fieldwork as part of the current research we know that some 8-16% of tenants secured landlord agreement to a rent reduction during the initial stages of the pandemic.
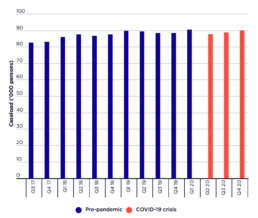
Average monthly Specialist Homelessness Services (SHS) assisted caseload
To monitor trends in homelessness between censuses, analysts usually focus on the cohort of SHS service users being assisted during the relevant period. This yields statistics on the cohort’s overall size, and on the circumstances and profile of those concerned. As shown in this graph there was little sign of any notable COVID-19 pandemic impact on homelessness in 2020. It should also be acknowledged that SHS service users include people designated as ‘at risk of homelessness’ as well as those actually homeless. The ‘assisted users’ statistics tracked in this figure are essentially ‘stock’ figures that include both ‘ongoing’ service users and people who sought SHS help during the period for the first time (or made a fresh claim for assistance, as former clients from a previous homelessness episode).
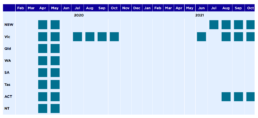
Overview of pandemic economic shutdowns by jurisdictions
This table shows the timeline of pandemic economic impacts in Australia's 8 state/territories. Crucial here have been the lockdowns that have impeded economic activity, with major implications for employment and incomes, as well as specifically for property transactions. The most significant point of this table is that Victoria alone experienced a long and economically damaging lockdown in the second half of 2020 – an experience which appears to have been reflected in some of the rental market patterns highlighted in subsequent graphs.
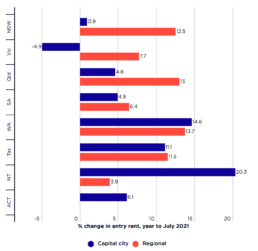
Asking rent change, Aug 2020-Jul 2021 – metro versus non-metro comparison
While 2020-21 saw a substantial overall increase in asking rents across Australia, there were market roperty type and inter-city variations. Additionally, there were sharp contrasts between metropolitan and regional markets, with rent rises particularly rapid in the latter. According to CoreLogic’s index, market rents across ‘combined capital cities’ increased by 6.4% in the 12 months to August 2021, whereas the comparable ‘combined regional’ figure was a remarkable 12.4% (CoreLogic 2021b). Especially in NSW, Victoria and Queensland, the rising regional markets indicated in this graph are particularly striking.
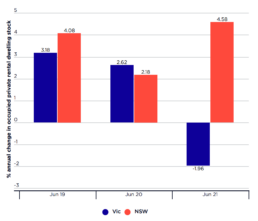
Annual change in total rental bonds held, June 2019 - June 2021
Nationally, households occupying a dwelling owned by a private landlord grew by an average of 3% per annum in the decade to 2017-18 (ABS 2019). While there are, as yet, no published statistics on the trajectory of private rental sector growth during the pandemic, we can look to rental bond board data in some jurisdictions to provide an indication of such change. Almost all private sector landlords require tenants to pay a bond at the commencement of a tenancy, and residential tenancies legislation in each state requires these bonds to be lodged with a state government agency; total bonds held by the state agency, therefore, is a proxy for the private rental dwelling stock. Evidence from NSW and Victoria presented in this graph indicates substantially contrasting trajectories in terms of private rental stock change over the period 2018-2021. Whereas annual growth remained above 2% in NSW across all three years, there was a 2% reduction in (occupied) private rental stock in Victoria in…