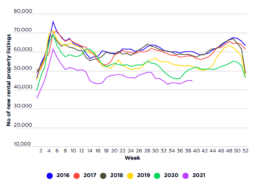
Number of existing and new rental listings (dwellings), 2016-2021
As evidence of the highly unusual rental supply conditions during the pandemic, CoreLogic data shows that rental property listings ran well below their historic norms during the first nine months of 2021. For example, in September 2021 new rental listings were running 23% below their 2016-2019 average, while total rental listings were 25% below the equivalent norm.
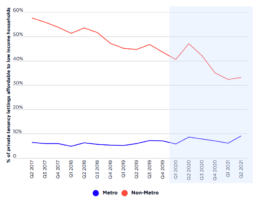
Rental affordability rates, Victoria, 2017-2021
Victorian Government statistics published in the state’s quarterly Rental Report indicate worsening regional affordability in that state.
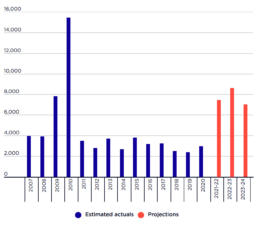
Actual and projected new social housing commencements, Australia, 2007 - 2023-24
The projected annual rate of social housing construction 2021-22 – 2023-24 represents almost a threefold increase over the pre-pandemic benchmark rate (7,750 versus 2,610).
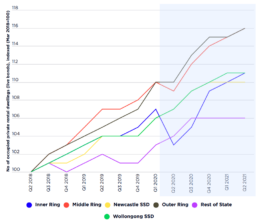
Total rental bonds held in NSW & private rental housing stock in Victoria, 2018-2021, indexed
These graphs illustrate private rental stock growth (or decline) rates at sub-jurisdictional scale before and during the pandemic. Despite their differences, there is a degree of consistency in that the early phase of the pandemic saw measurable reductions in capital city private rental populations – albeit that these were more dramatic in size and sustained over time in Melbourne than in Sydney. Numerically, this involved a reduction of some 18,000 occupied private rental dwellings across metropolitan Melbourne – mainly in the Cities of Melbourne and Stonnington, as well as Port Phillip and Boroondara. One other significant point to note is the static stock of private tenancies in non-metropolitan Victoria and in ‘rest of NSW’ – essentially the area beyond the Sydney Greater Metropolitan Region. Any increase in demand for rental housing in these localities is therefore likely to have contributed to rising rents.
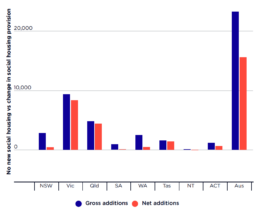
Projected social housing commencements 2021-22 – 2023-24, and projected net change in social housing provision
Despite the significant increase in overall social housing construction anticipated over the next three years, the resulting net change in provision will be inadequate to prevent a further reduction in the sector’s share of all housing, Australia-wide. According to our projections this will decline from 4.22% to 4.14% of estimated total dwelling stock over the period.
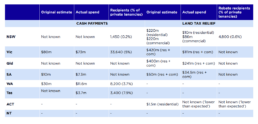
Rent relief expenditures, 2020
The available evidence is patchy but indicates that many of the rent relief schemes were significantly undersubscribed compared to original estimated costs. The NSW land tax scheme paid rebates on just 4,800 residential properties – equivalent to 0.6% of private tenancies in New South Wales. The total expended on residential rebates was $10m: less than five per cent of originally estimated expenditure (while $86m was expended on rebates for commercial properties: 40% of the original estimate) (NSW Parliament, 2021). Victoria, with its long 2020 lockdown, made cash payments to 33,640 applicants – equivalent to about 5% of Victorian private tenancies – totalling $73m (91% of the original estimated expenditure); however, its total land tax rebate expenditure was $111m, much less than the $400m originally estimated. After a significant underspend in the WA scheme, its terms were changed to pay where a landlord is offering a new fixed term tenancy at an increased rent . The ACT reports in…
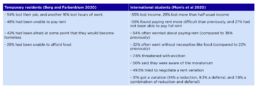
Temporary residents’ and international students’ experiences in the COVID emergency, 2020
During 2020, a significant group of temporary residents remained in Australia but excluded from the main means of absorbing the economic shock of the early emergency, and were protected primarily by the eviction moratoriums, rent variations and rent relief schemes. Contemporary surveys of temporary residents and international students show high rates of significant hardship experienced by these groups during the 2020 emergency, as shown in this table.

Mental health conditions by weekly equivalised household income
Those with lower weekly household incomes report higher levels of mental health conditions.

Heart, stroke and vascular diseases, diabetes and arthritis by main income source
Those receiving government pensions/allowances and aged under 65 reported higher levels of heart, stroke and vascular diseases, diabetes and arthritis than those whose main income was wages or salary.

Heart, stroke and vascular diseases, diabetes and arthritis by SEIFA
Those within lower socio economic indexes for areas reported higher levels of Heart, stroke and vascular diseases, diabetes and arthritis than those in higher socio economic indexes for areas (SEIFA). To find out more about SEIFA, go to https://www.abs.gov.au/websitedbs/censushome.nsf/home/seifa