
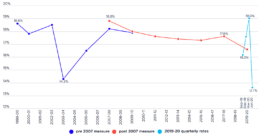
Percentage of children in poverty from 1999-2019
This graph shows the percentage of children in poverty from 1999 - 2019, using the 50% of median income after-housing costs poverty line.
The poverty line used is 50% of median income, taking account of housing costs. The lower (dark blue) line shows poverty rates measured using the pre-2007 ABS income definition, while the higher (red) line is based on the post 2007 income definition. The light blue line shows the quarterly changes in poverty rates during the 2019-20 period.
It shows that child poverty, alongside the overall poverty rates, declined substantially from 1999 to 2003 (from 18.6% to 14.3%), then rose to 18.8% in 2007. It fell gradually to 17.6% in 2017.
It also shows that child poverty rose sharply than fell dramatically during the first year of the pandemic (2019-20); from 16.2% in the September quarter of 2019 to 19% in the March quarter of 2020, then fell to 13.7%, a two-decade low, in June 2020.
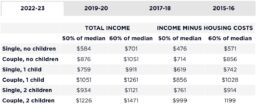
Poverty lines by family type
This table shows poverty lines by family type in dollars per week, including social security payments. This shows relative poverty in Australia using poverty lines of 50% and 60% of national median household income. More information on the definitions of poverty and different ways of measuring poverty can be found on our poverty page and our FAQ page. It also shows the poverty lines before and after housing costs are taken into account (known as before and after housing costs; or as total income and income minus housing costs). Housing costs vary considerably among households, depending on whether those households are owners, purchasers or tenants and what part of Australia those households live in. In order to take into account the varying costs of housing, a separate set of ‘after housing costs’ (or 'income minus housing costs') poverty lines is used. This set is created by removing housing costs from disposable income before calculating the median income. This is a measure of the…
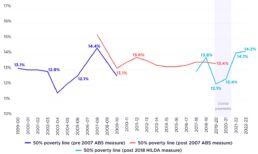
Percentage of all people in poverty from 1999 - 2023
This figure shows the percentage of all people in poverty from 1999-00 to 2022-23. It shows how the rate of poverty declined from 13.4% in 2017-19 to 12.1% in 2019-20, then rose to 12.4% in 2020-21, and even further to 14.1% in 2021-22. The poverty line used is 50% of median income, taking account of housing costs. The lower (dark blue) line shows poverty rates measured using the pre-2007 ABS income definition, while the higher (red) line is based on the post 2007 income definition; the data shown is from the ABS Survey of Income and Housing. The light blue line shows poverty as measured using the Household Income and Labour Dynamics in Australia (HILDA) survey from the Melbourne Institute.'
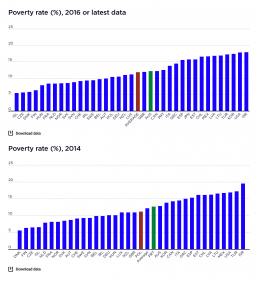
Poverty rates in OECD countries
[infogram id="_/Xd48aJpgkLnpVZZcd60A" prefix="8ng" format="interactive" title="Copy: Poverty rates in OECD countries in 2016 (% of people)"] Although the Organisation for Economic and Social Development (OECD) uses the 50% median income poverty line, differences in research methodology mean that the results are close to but not identical to those reported in this website for Australia. 2021 or latest data This graph shows poverty rates among the Organisation for Economic and Social Development (OECD) countries in 2021 (or latest data), using the 50% median income poverty line. The OECD’s estimate for the overall rate of poverty in Australia according to this graph is 12.6% (compared with our estimate for 2019-20 of 13.4%). This makes Australia’s poverty rate the 15th highest among the 38 OECD countries. 2017-18 This graph shows poverty rates among the Organisation for Economic and Social Development (OECD) countries in 2016, using the 50% median income poverty line. The OECD’s…

Percentage of people receiving JobKeeper and COVID Supplements by household income groups
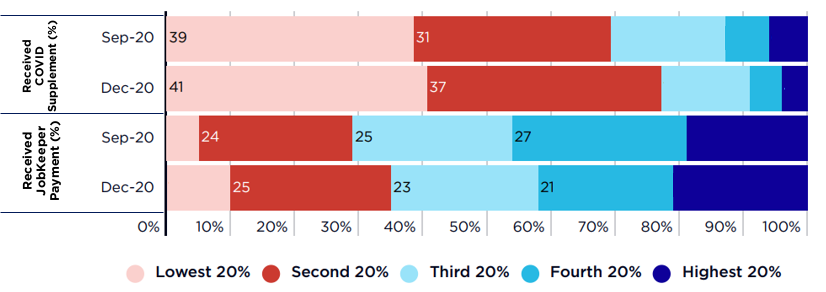 This figure shows shows how COVID income support payments were distributed among households ranked by income in 2020.
JobKeeper Payment mainly lifted the incomes of middle income-households at risk of losing their jobs, and Coronavirus Supplement lifted the incomes of low-income households on income support payments.
Towards the end of the recession in September 2020:
* Around three quarters (76%) of JobKeeper Payments went to the middle 60%;
* A similar proportion of the Coronavirus Supplement (70%) went to the lowest 40%.
* The highest 20% received just 19% of the value of JobKeeper Payment and 6% of that of Coronavirus Supplement.
This figure shows shows how COVID income support payments were distributed among households ranked by income in 2020.
JobKeeper Payment mainly lifted the incomes of middle income-households at risk of losing their jobs, and Coronavirus Supplement lifted the incomes of low-income households on income support payments.
Towards the end of the recession in September 2020:
* Around three quarters (76%) of JobKeeper Payments went to the middle 60%;
* A similar proportion of the Coronavirus Supplement (70%) went to the lowest 40%.
* The highest 20% received just 19% of the value of JobKeeper Payment and 6% of that of Coronavirus Supplement.
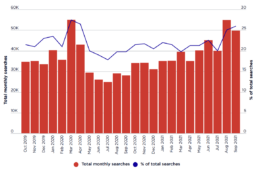
Internet searches for food assistance from October 2019 to September 2021
[infogram id="_/5if5bxex3dtdcECUonnF" prefix="mcJ" format="interactive" title="Figure 13_Internet searches, Australia"] This graph shows trends in internet searches for food relief from before the COVID recession in October 2019 to September 2021: It shows similar peaks in searches for food relief at the start of the national lockdown in March 2020 and those in Sydney, Melbourne and Canberra in August 2021, which were experiencing lockdowns at the time. Significantly, demand fell between March and July 2020 as COVID income supports were introduced, and gradually rose through 2021 after they were removed.
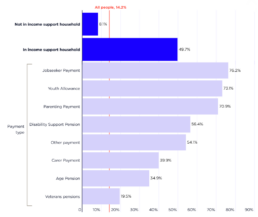
Poverty in households reliant on income support payments (% of all people in poverty)
2022-23 In 2022-23 there were 3,815,000 people (including children) in income support households, of whom 1,894,000 (50%) were in poverty. In the analysis below, we classify these households according to the highest income support payment received (for example, Jobseeker Payment or Age Pension). The highest poverty rates among people in income support households were for those relying on Jobseeker Payment (76% or 250,000 people), Youth Allowance (73% or 29,000) and Parenting Payment (71% or 204,000 people), followed by Disability Support Pension (56% or 362,000), Age Pension (35% or 574,000 people) and Carer Payment (40% or 106,000). 2019-20 This graph shows that poverty among people on working age income support payments fell sharply in the COVID recession. It shows that poverty among people in households on Jobseeker Payment fell by four-fifths, from 76% in 2019 to 15% in June 2020.
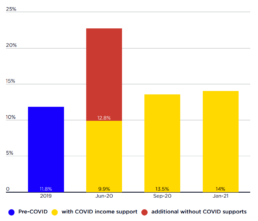
Poverty with and without COVID income supports
These graphs show the number and rate of people in poverty during the COVID recession and early stages of the recovery up to January 2021. They use the 50% of equivalent disposable household income, and the results have been adjusted to take account of housing costs, and shows the difference that the COVID income support payments (mainly Coronavirus Supplement and JobKeeper Payment) made to the number and rate of people in poverty. [infogram id="_/Qja04e8lBmpSwzbuh2jz" prefix="aPU" format="interactive" title="Figure 8a_Poverty with and without COVID income supports"] [infogram id="_/YuchlEUUjUwQrtYMpoCa" prefix="Twy" format="interactive" title="Figure 8b_poverty with and without COVID income supports (number of people)"] The graphs show that: * In June 2020, 9.9% of people were below the poverty line, compared with 11.8% in 2019 and 22.7% who would have been in poverty in June 2020 without the new income supports (Figure 8a). * An estimated 2,613,000 people were in poverty in June…
Financial stress among social security recipients and all people (2020)
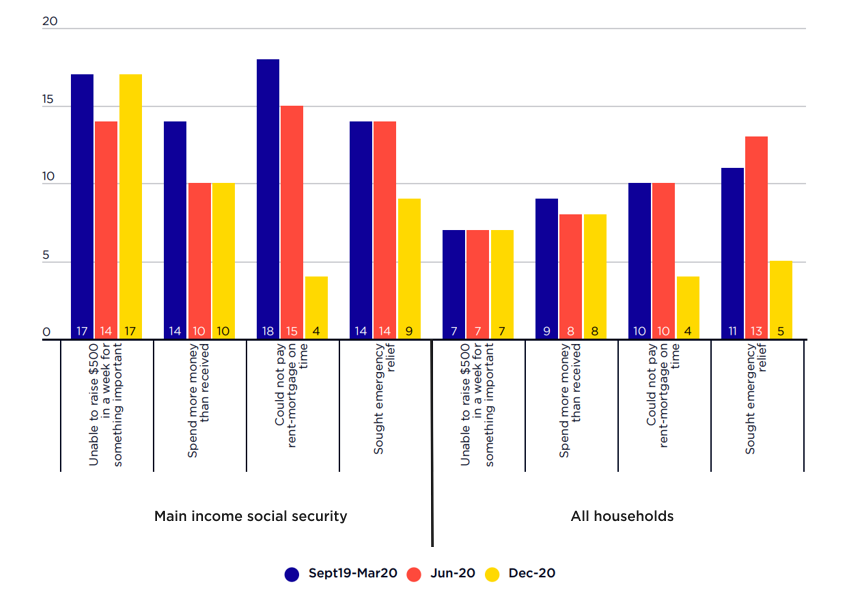 This graph shows trends in key financial stress indicators.
From September 2019 to December 2020:
* The proportion of people on social security unable to pay their rent or mortgage on time fell from 18% to 4%, while the proportion of the overall population fell from 10% to 4% (aided by rent and mortgage amnesties);
* The proportion of people on social security seeking emergency relief fell from 14% to 9% while the proportion of the overall population fell from 11% to 5%.
This graph shows trends in key financial stress indicators.
From September 2019 to December 2020:
* The proportion of people on social security unable to pay their rent or mortgage on time fell from 18% to 4%, while the proportion of the overall population fell from 10% to 4% (aided by rent and mortgage amnesties);
* The proportion of people on social security seeking emergency relief fell from 14% to 9% while the proportion of the overall population fell from 11% to 5%.