
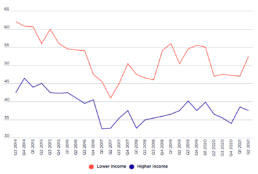
NAB financial stress index, 2014 to June 2021
[infogram id="_/7LbMYbStRHUZDOoryk8t" prefix="dOb" format="interactive" title="Figure 12_NAB financial stress index"] This graphs shows trends in the NAB financial stress index from 2014 to the June quarter of 2021. This measure of financial stress fell sharply in the second quarter of 2020, despite the recession. It then rose sharply in the first two quarters of 2021 among people on low incomes as COVID income supports were reduced and then removed.
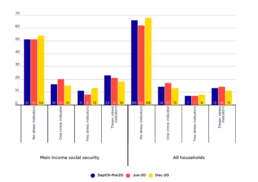
Financial stress in recession and recovery (2020)
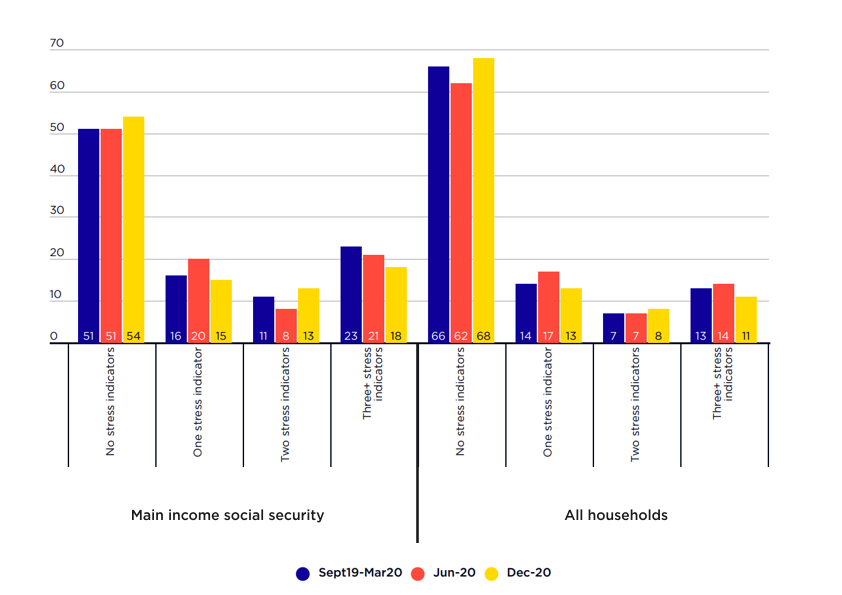 This graph compares financial stress indicators among people whose main income was social security and the overall population, before and shortly after the COVID recession. There were significant reductions in financial stress over this period.
Between September 2019 and December 2020:
* The proportion of people reporting the most severe financial stress (three or more indicators) fell from 23% to 18% among those on social security payments and from 13% to 11% among the overall population.
* The proportion with no stress indicators rose from 51% to 54% among those on social security payments and from 66% to 68% among the overall population.
This graph compares financial stress indicators among people whose main income was social security and the overall population, before and shortly after the COVID recession. There were significant reductions in financial stress over this period.
Between September 2019 and December 2020:
* The proportion of people reporting the most severe financial stress (three or more indicators) fell from 23% to 18% among those on social security payments and from 13% to 11% among the overall population.
* The proportion with no stress indicators rose from 51% to 54% among those on social security payments and from 66% to 68% among the overall population.
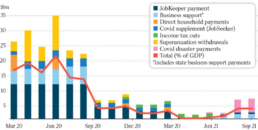
Fiscal stimulus
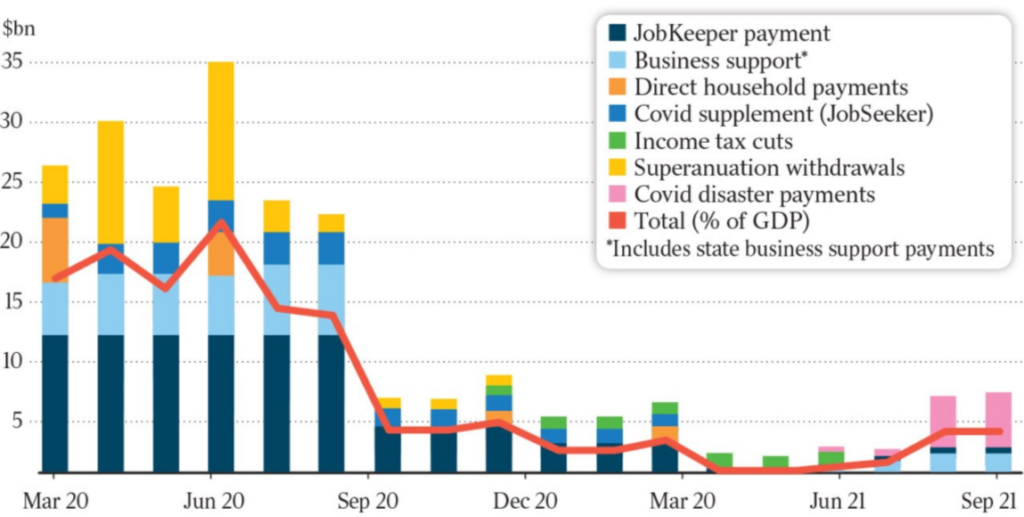 Source: Cacho C (Chief Economist, Jarden) cited in: Commins P, Targeted stimulus cuts billions off the bill, The Australian 3/9/21
Note: Monthly expenditure on COVID income supports averaged around $20 billion per month from March to September 2020, fell to less than $5 billion per month during the recovery from October 2020 to June 2021, then rose to around $7 billion per month in the second wave from August to September 2021.
This graph shows all the fiscal stimulus measures introduced during the COVID pandemic during 2020 and 2021.
Source: Cacho C (Chief Economist, Jarden) cited in: Commins P, Targeted stimulus cuts billions off the bill, The Australian 3/9/21
Note: Monthly expenditure on COVID income supports averaged around $20 billion per month from March to September 2020, fell to less than $5 billion per month during the recovery from October 2020 to June 2021, then rose to around $7 billion per month in the second wave from August to September 2021.
This graph shows all the fiscal stimulus measures introduced during the COVID pandemic during 2020 and 2021.
Unemployment rate and effective unemployment rate
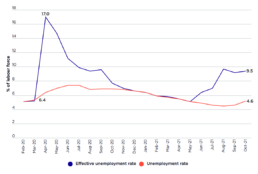
[infogram id="_/bLtBHwWvM2v6zTCOQ5iB" prefix="snu" format="interactive" title="AFigure2_Unemployment rate and effective unemployment rate"] This graph compares the unemployment rate with the effective unemployment rate, a composite measure introduced by the Australian Bureau of Statistics during the COVID-19 pandemic made up of unemployed people, employed people who still had a job but worked zero hours for economic reasons, and the reduction in the labour force compared with pre-lockdown levels.
Proportion of all people in lockdown (March 2020 to September 2021)
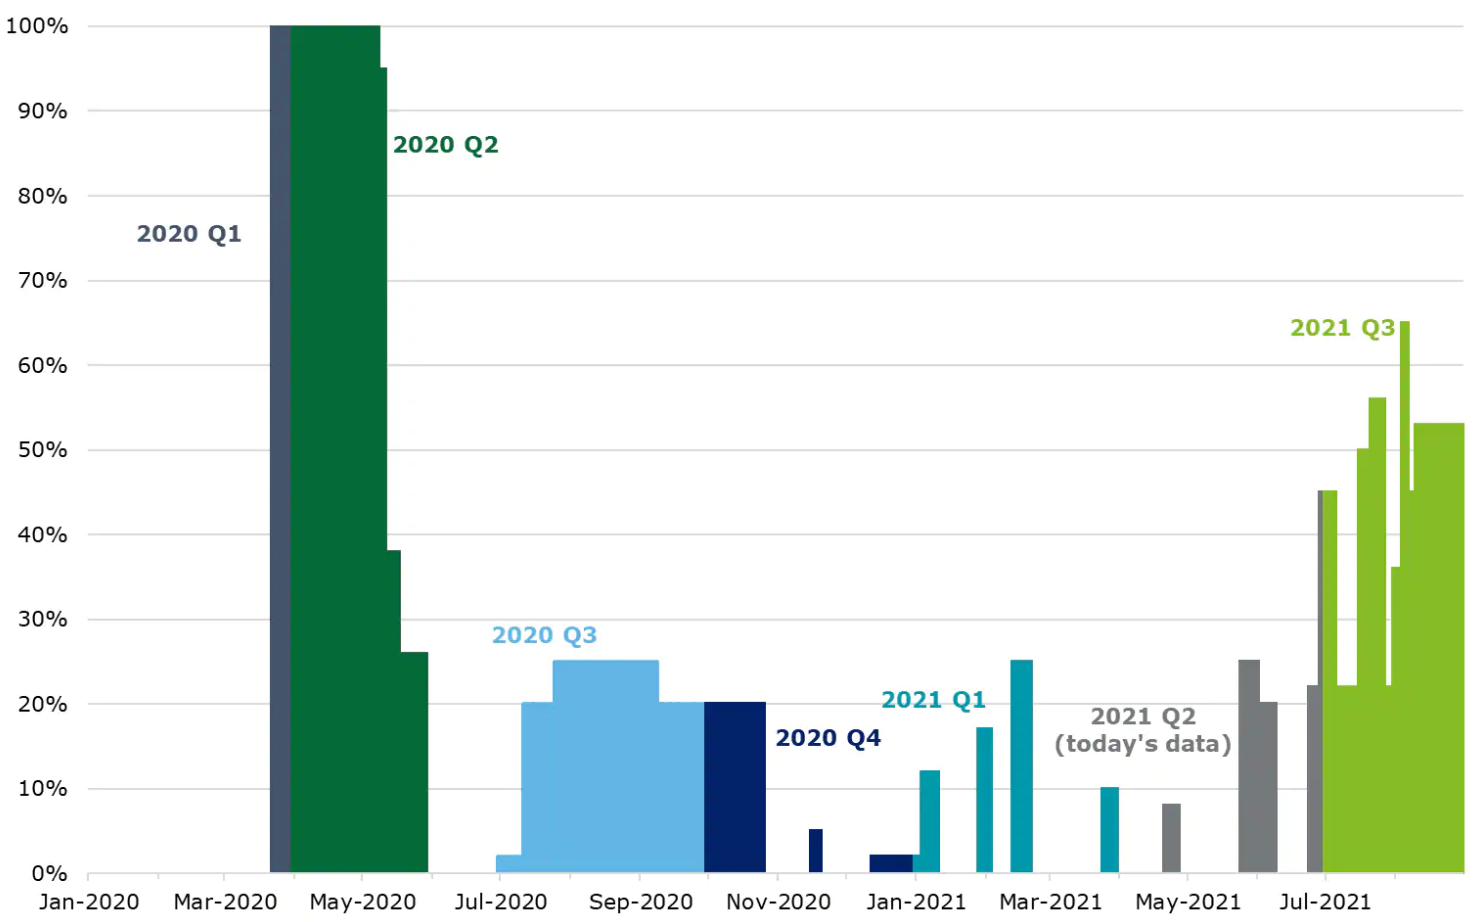 Source: Derwin J (2021), ‘Australia has avoided another recession for now. But economists warn we’re in ‘the eye of the storm.’ Business Insider 1/9/2021.
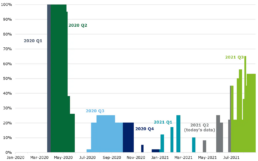
This graph shows the proportion of people in Australia who were in lockdowns from Jan 2020 to July 2021.
Source: Derwin J (2021), ‘Australia has avoided another recession for now. But economists warn we’re in ‘the eye of the storm.’ Business Insider 1/9/2021.
This graph shows the proportion of people in Australia who were in lockdowns from Jan 2020 to July 2021.
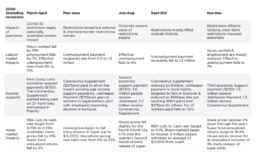
Timeline of the pandemic impacts and policy responses
[infogram id="_/ChvsYV2Rgf7Ht0H31oSc" prefix="oq9" format="interactive" title="Table A1_Timeline of the pandemic impacts and policy responses"] This table shows the impacts of the pandemic in terms of restriction, employment, income support measures and the impacts on the asset market, both during the COVID recession period in 2020 and during the 2021 economic recovery period.
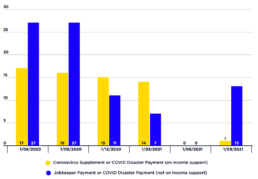
Recipients of Coronavirus Supplement, Jobkeeper Payment and COVID Disaster Payments (% of labour force)
[infogram id="_/euZbKYS5chlpvvSg8DRy" prefix="CQ5" format="interactive" title="Figure 15_Recipients of COVID income support payments"] This graph shows that, during the COVID recession in June 2020, 2.2 million people on working-age income support payments (equal to 17% of the labour force) received the Coronavirus Supplement and 3.6 million people who were still employed (equal to 27% of the labour force) received JobKeeper Payment. These two COVID payments were reduced in late 2020 and removed in April 2021.
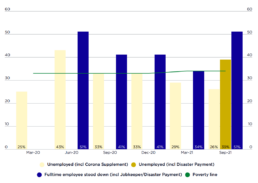
COVID income support for unemployed & fulltime employees (% of median fulltime wage)
[infogram id="_/7NIorqI67sC1jMJHsi5X" prefix="UF8" format="interactive" title="Figure 14_Level of COVID income support"] This graph compares the poverty line for a single adult living alone with maximum rates of JobSeeker Payment together with Rent Assistance and the Coronavirus Supplement, JobKeeper Payment, and the COVID-19 Disaster Payment, which was introduced in the second wave of the pandemic. All values are expressed as a proportion of the median weekly fulltime wage. The income supports available to a single adult without children who was unemployed were set above the poverty line in the recession, but drifted below it as the Coronavirus Supplement was reduced: * In June 2020 (when the Supplement was $275pw) their income was around 30% above the poverty line. * In September 2020 (after it was reduced to $125pw) they were close to the poverty line. * In March 2021 (after it was reduced to $75pw), they were around 15% below it. * In June 2021, (after the $25pw increase in…

Comparison of poverty rates measured before and after housing costs
This graph allows us to gauge the impact of trends in housing costs on poverty. [infogram id="_/JdvS20WyMg9vFUq2psCX" prefix="8Wj" format="interactive" title="Comparison of poverty rates measured before and after housing costs, 1999-00 to 2017-18"] The difference in poverty rates measured using these two poverty lines shrunk from 3.5 percentage points in 1999 to 2.1 percentage points in 2007. This suggests that the increase in poverty during that period was mainly due to greater disparities between low and middle-incomes, rather than changes in housing costs. After 2007, this pattern was reversed. The difference in poverty rates measured using the two poverty lines grew from 2.1 percentage points in 2007 to 4.7 percentage points in 2017. This suggests that the stabilisation of poverty rates after 2007 when housing costs were deducted from incomes (red line - top) was mainly due to increasing disparities in the housing costs of low and middle income households. As shown by the blue…