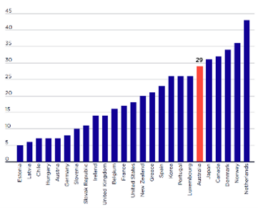
Share of indebted households with debt-to-annual income ratio above three
The Organisation for Economic Cooperation and Development (OECD) regards households in the lowest 40% by income with debt at least 3 times their annual disposable income as ‘over-indebted’ and therefore at-risk financially. Australia ranks 6th highest on this measure among 23 OECD countries, with 29% of low-income households over-indebted. Due to our high and rapidly growing home prices and relatively easy access to credit, Australian households are more indebted than in most other wealthy nations.
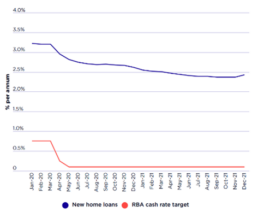
Interest rates from 2019 to 2021 (% per annum)
In April 2020 the Reserve Bank reduced its cash rate target to an historic low of 0.1%. Consequently, typical interest rates for new home loans fell to 2-3%. These and other interest rate reductions boosted investment in housing, increasing demand and putting strong upward pressure on house prices and housing wealth.
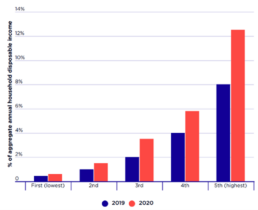
Gross household saving by income quintile
Between 2020 and 2021, the rate of saving by the highest 20% of households ranked by income rose by half (from 8% to 12% of disposable income), along with that of the middle 20% (from 2% to 3%). The average saving rate for the lowest 20% was less than 1% throughout this period.
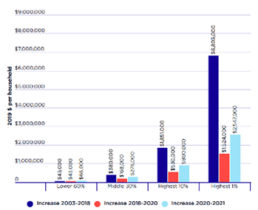
Increase in wealth, by wealth group since 2003
During the sustained period of economic growth from 2003-04 to 2018-19, wealth inequality increased sharply: * The wealth of the highest 1% of households rose (after inflation) by an average of $6.8 million or 84%; * The wealth of the highest 10% rose by an average of $1.9 million or 65%; * That of the middle 30% rose by an average of $380,000 or 44%; * That of the lower 60% rose by just $45,000 or 20%. In the first 2 years of the pandemic (during 2019-20 and 2020-21 including the recession), wealth inequality declined slightly: * The wealth of the highest 1% of households rose by an average of $1.5 million or 10%; * The wealth of the highest 10% rose by an average of $530,000 or 11%; * That of the middle 30% rose by an average of $168,000 or 13%; * That of the lower 60% rose by an average of $43,000 or 16%. In the third year of the pandemic (2021-22, a year of economic recovery), wealth inequality declined further: * The wealth of the highest 1% of households rose by an average of…
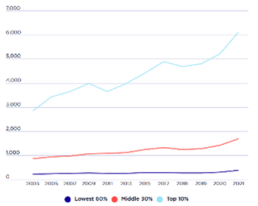
Average wealth by wealth group ($)
Consistent with the findings of our last Inequality in Australia report, wealth is still very unequally distributed in 2021-22. *The highest 10% of households by wealth has an average of $6.1 million or 46% of all wealth. *The next 30% have an average of $1.7 million or 38% of all wealth. *The lower 60% has an average of $376,000 or 17% of all wealth.
Profile of wealth of each wealth group
There is a significant inequality in wealth between of the highest 10% and the lowest 60% people in Australia. This graph presents the wealth profiles of these groups. Of the wealth of the richest 10% in 2021: • A higher proportion was held in investment property (18%), shares, bonds and trusts (13%), and own-business assets (9%), compared with 8%, 3% and 2% respectively for the middle 30%; • A lower proportion was held in their homes (32%), superannuation (19%), deposits (5%), and durables (4%), compared with 50%, 21% and 9% respectively for the middle 30%. Of the wealth of the lower 60% in 2021: • Higher proportions were held in superannuation (23%), durables (17%) and deposits (8%), compared with 21%, 9% and 7% respectively for the middle 30%; • A similar proportion was held in their homes (48% compared with 50%, taking account of people who were not owner-occupiers); • Almost negligible proportions were held in investment property (4%), shares, bonds and trusts (1%), and…
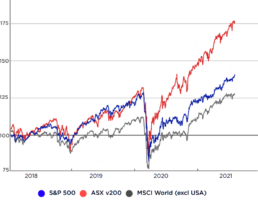
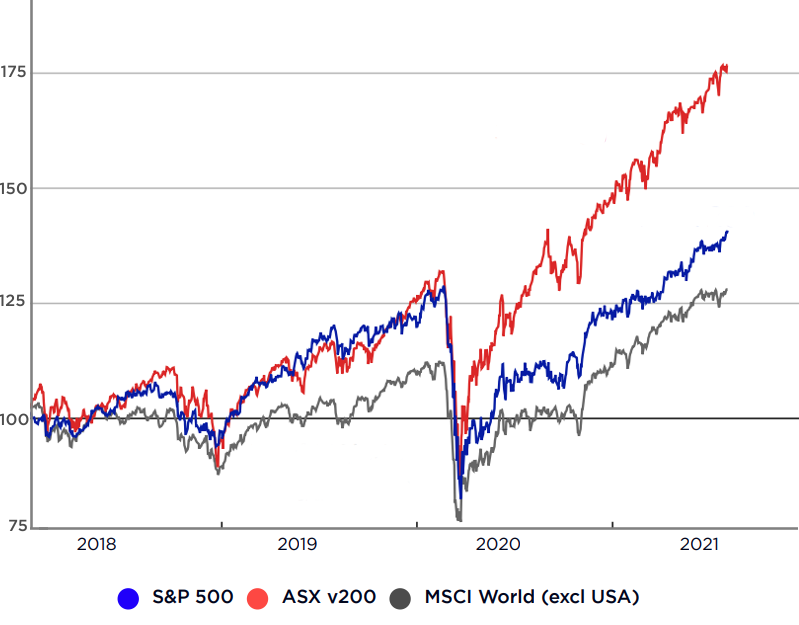
Total return indices
 Source: Reserve Bank of Australia (2021), Statement on Monetary Policy, August 2021.
Share prices in Australia and other countries in which Australians invest responded quickly to the recession, falling sharply. Over the following year they grew strongly - to end well above their average values from the beginning of 2020.
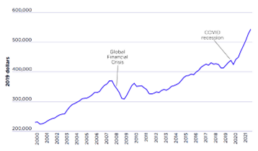
Household wealth per capita (2019 dollars)
This graph shows the longer-term trend in household wealth per capita since 2000 (per person rather than household so the numbers are lower than in our distributional analysis), adjusted for inflation. Since the recovery had a far greater impact on asset values than the recession, average household wealth rose by $341,000 over the 3 years from 2018 to 2021 after adjusting for inflation, compared with an increase of $327,000 over the 15 years from 2003 to 2018:15. * After declining by 3% in the March quarter 2020 (at the onset of recession), average household wealth rose by 12% to December 2020, then by an extraordinary 26% to December 2021. * On average, it rose by 11% per year after inflation from 2018 to 2021, compared with just 3% per year from 2003 to 2018.
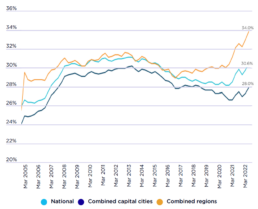
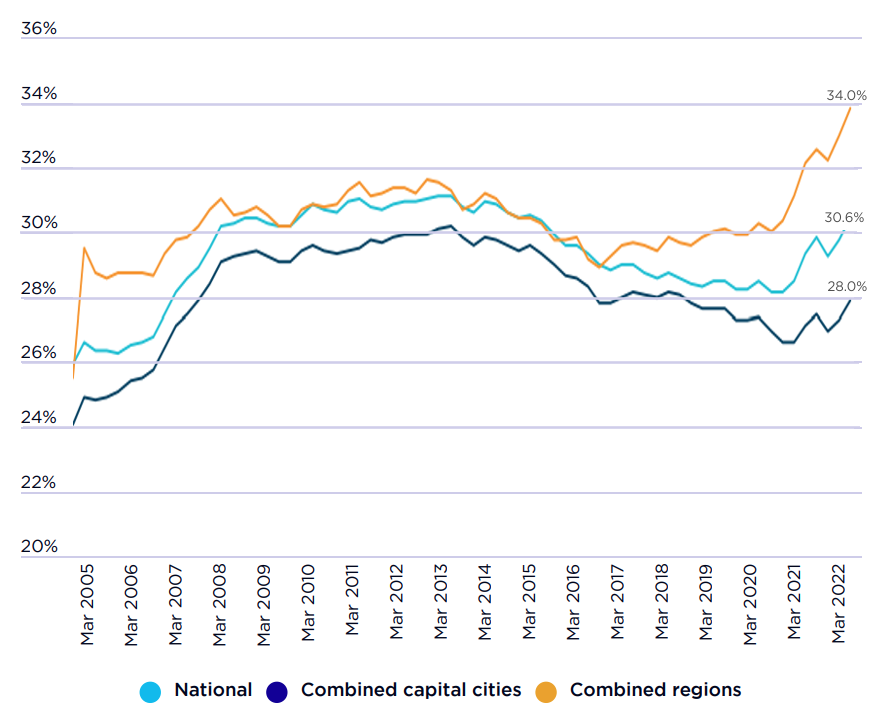
Proportion of median income required to pay the median rent (%)
 Source: ANZ Corelogic housing affordability report, March 2022 Note: Assumes owner has borrowed 80% of median dwelling value and is paying the average discounted variable mortgage for a term of 25 years
This graph shows that the proportion of median household disposable income required to pay the median rent rose from 26% to 31% between 2003 and 2021.
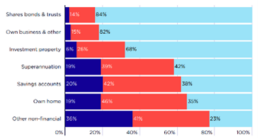
Share of all wealth by asset type held by each wealth group
From 2018 to 2022, the share of overall wealth held in owner-occupied homes rose from 37% to 41%. The predominance of owner-occupied housing in wealth accumulation through the pandemic moderated overall wealth inequality because owner-occupied housing is relatively concentrated in the middle 30% of the wealth distribution In 2021, the middle 30% held 46% of owner-occupied housing wealth, compared with 39% of superannuation, 26% of investment property, and just 14% of shares and 15% of own-business assets. In contrast, the richest 10% held 35% of owner-occupied housing, 42% of superannuation, 68% of investment property, 84% of shares and 82% of own-business assets
