
Average wealth per adult in 2020
According to Credit Suisse’s Global Wealth Report, the average wealth of Australian households was $628,000 per adult in 2020, the fourth highest in the world behind Switzerland, the United States and Hong Kong (North America as shown on the graph refers to the region, as does Asia-Pacific and Europe).

Average wealth of households by age, as a percentage of the average wealth of all (%)
This graph shows that wealth inequality has increased across generations since 2003, especially in the distribution of owner-occupied housing. As a proportion of the average value of owner-occupied homes held across all age groups: • The average value held in households with a reference person under 35 years fell from 31% in 2003 to 26% in 2021; • That of those aged 35-44 years fell from 82% in 2003 to 69%; • That of those aged 64 years rose from 140% in 2003 to 144%.


Share of wealth held by households ranked by wealth (% in 2021)
Consistent with the findings of our Inequality in Australia 2020 report, wealth is still very unequally distributed in 2021-22. * The highest 10% of households by wealth has an average of $6.1 million or 46% of all wealth. *The next 30% have an average of $1.7 million or 38% of all wealth. * That leaves the majority – the lower 60% - with $376,000 or just 17% of all wealth.

Wealth inequality (Gini coefficient)
This graph shows trends in a summary measure of inequality, the ‘Gini coefficient’. The Gini varies across a range from zero (equal wealth) to one (where all wealth is held by a single household). It rose sharply from 0.573 in 2003 to 0.624 in 2018; and then declined slightly to 0.613 by 2021, close to the level reached around 2016.
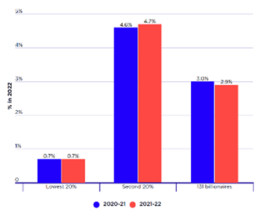
Share of all wealth held by 131 billionaires compared with low-wealth groups (%)
The 131 billionaires comprised 0.001% of the population yet held 2.9% of all household wealth in 2021, a decline from 3% in 2020. This graph shows that they held more wealth among them than the lower 20% of households ranked by wealth (who held 0.7% of all wealth) and somewhat less than the second-lowest 20% (with 4.7%). This suggests that 131 individuals held almost as much wealth between them as the 2.8 million households in the lowest 30% ranked by wealth.
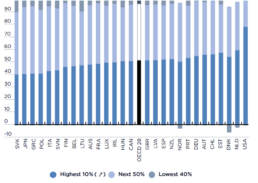
Shares of overall wealth held by the lowest 40%, middle 50% and highest 10% around 2018 (%)
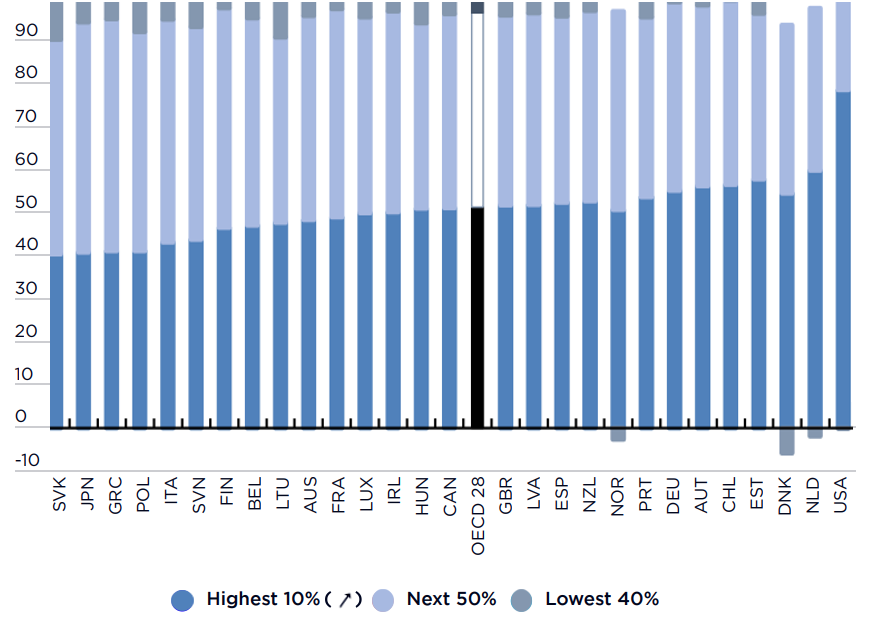 Source: OECD (2021) Inequalities in household wealth and financial insecurity of households, OECD Policy Insight. Note: Households are ranked according to wealth.
The level of wealth inequality in Australia around 2018 (before the pandemic) was somewhat below the average among 28 wealthy nations surveyed by the OECD. The highest 10% of households ranked by wealth held approximately 45% of all wealth in Australia compared with an OECD average of approximately 50%.
The high level of home ownership and housing wealth in Australia is a major reason for this.
Source: OECD (2021) Inequalities in household wealth and financial insecurity of households, OECD Policy Insight. Note: Households are ranked according to wealth.
The level of wealth inequality in Australia around 2018 (before the pandemic) was somewhat below the average among 28 wealthy nations surveyed by the OECD. The highest 10% of households ranked by wealth held approximately 45% of all wealth in Australia compared with an OECD average of approximately 50%.
The high level of home ownership and housing wealth in Australia is a major reason for this.
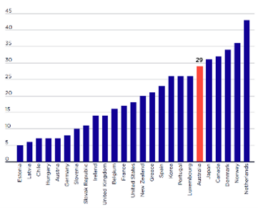
Share of indebted households with debt-to-annual income ratio above three
The Organisation for Economic Cooperation and Development (OECD) regards households in the lowest 40% by income with debt at least 3 times their annual disposable income as ‘over-indebted’ and therefore at-risk financially. Australia ranks 6th highest on this measure among 23 OECD countries, with 29% of low-income households over-indebted. Due to our high and rapidly growing home prices and relatively easy access to credit, Australian households are more indebted than in most other wealthy nations.
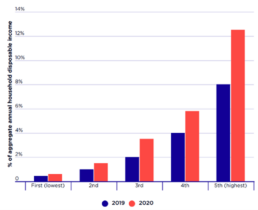
Gross household saving by income quintile
Between 2020 and 2021, the rate of saving by the highest 20% of households ranked by income rose by half (from 8% to 12% of disposable income), along with that of the middle 20% (from 2% to 3%). The average saving rate for the lowest 20% was less than 1% throughout this period.