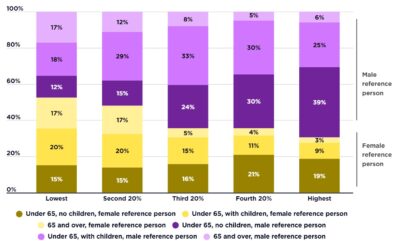
This graph shows the make-up of each income group by family type.
[infogram id=”_/d9KgYeaVjQvDQQxATvuI” prefix=”j1r” format=”interactive” title=”Fig.8_Profile of each income group by family type (2016)”]
2017-18: The graph shows that 42% of people in the lowest 20% income are single, either with or without children, compared with only 8% of those in the highest 20% income group. a majority of people in the lowest 20% income group are in couple families (55%).
2015-16: The graph shows that 32% of people in the lowest 20% income group are single, either with or without children, compared with only 8% of those in the highest 20% income group. A majority of people (57%) in the lowest 20% income group are in couple families, a reflection of their greater share (64%) of the overall population.