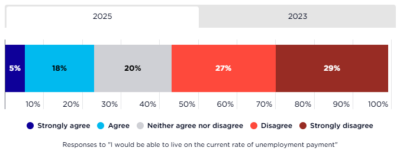
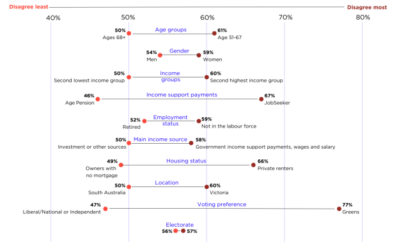
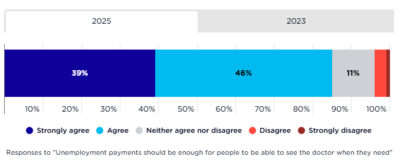
This chart shows the demographic distribution of responses in our Community attitudes towards poverty and inequality survey to the phrase Nobody deserves to live in poverty
- By age: Agreement increased by age group from 82% (aged 18 to 30) to 90% (aged 68 and above).
- By gender: More women agreed with this statement (91%) than men (81%).
- By income: Agreement decreased by income from 89% (lowest income quintile) to 83% (highest income quintile).
- By income support payment: People in the lowest income quintile who were receiving JobSeeker payments agreed most (94%) and people receiving disability payments agreed least (79%).
- By employment status: People who had retired agreed most (90%) and people who were not employed agreed least (82%).
- By income source: People who were receiving government income support payments agreed most (90%) and people who were self-employed agreed least (81%).
- By housing status: Tenants in private rental agreed most (90%) and people who were not a homeowner or tenant (i.e., had ‘other’ housing arrangements) agreed least (78%).
- By location: Differences in agreement by state (85–89%) were small.
- By voting preference: People who voted Greens agreed most (91%) and people who voted Liberal/National agreed least (82%).
- By electorate: Differences by party affiliation of elected parliamentary representative were small (85–89%).