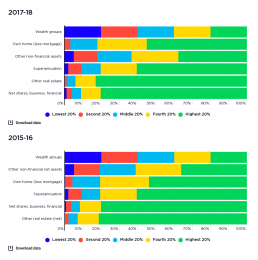
Shares of wealth across wealth groups by asset type
This graph shows how different types of wealth holdings are distributed across wealth groups. It shows that ownership of shares, investment real estate and superannuation is highly concentrated. [infogram id="_/E0NBFngbco6CKd2ZGEwy" prefix="MaQ" format="interactive" title="2017-18: Fig.16_Shares of wealth across income groups by asset type (2016)"] 2017-18: The wealthiest 20% group holds 81% of shares and other financial investments; and 83% of investment property. Superannuation is also shared unequally, with 61% by value held by the highest 20%, and 20% held by the next highest wealth group. Owner-occupied housing is more equally distributed, with 55% by value held by the highest 20%, and 27% by the second-highest wealth group. 2015-16: The highest 20% of the wealth distribution owns over 80% of all wealth in investment properties and shares and over 60% of all superannuation assets. Household wealth in the residential home is more evenly distributed, though the highest 20% still…
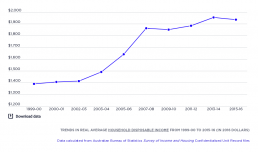
Trends in real average household disposable income since 1999-00
[infogram id="_/HBJ5SXNoKbAAq7gJ98cs" prefix="3NF" format="interactive" title="Fig.1_Trends in real average household disposable income from 1999-00 to 2015-16 (in 2016 dollars)"] This shows how average household disposable incomes have grown in ‘real terms’ (after inflation) in Australia between 1999-00 and 2015-16. During the boom period from 2000 to 2008, average household disposable income grew by a remarkable 4.3% per year in real terms. This reflected rapid overall economic growth underpinned by mining and housing booms. However, in 2008, the Global Financial Crisis cut economic growth by half. This reduced average disposable income slightly the following year. Average income then slowly increased, and dropped slightly again in 2015-16.
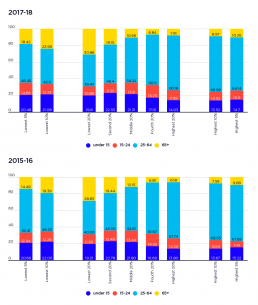
Profile of each income group by age
This graph shows the make-up of each income group by age. [infogram id="_/eDbRF9QdpI3mCfj46LMV" prefix="Fyc" format="interactive" title="2023-fig2_Profile of each income group by age"] 2019-20: The largest age-group in every income group are 25-64 year olds, as they have a greater share of the population as a whole. However, the lowest income group comprises almost a third of older people, while they comprise only 8% of the highest income group. 2017-18: The largest age-group in every income group are 25-64 year olds, reflecting their greater share of the overall population. However, older individuals are over-represented (66%) in the lowest 40% income group, as are children aged under 15 (45%). Almost half (48%) of people of working age, 25-64 years, were in the highest 40% income group, reflecting that age group’s larger size and greater earning capacity. 2015-16: The largest age-group in every income group are 25-64 year olds. However, older individuals are over-represented (29%)…
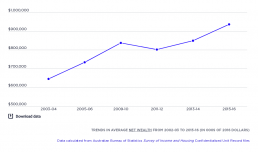
Trends in average wealth
[infogram id="_/y82cwAVmMk95OG13RsZq" prefix="AGD" format="interactive" title="Fig.2_Trends in average wealth from 2002-03 to 2015-16 (000s of 2016 dollars)"] This shows changes in the real value (after inflation) of net household wealth. The average value of household wealth (minus debts such as home mortgages) rose steadily from $644,000 in 2003-04 to $836,000 in 2009-10, when the Global Financial Crisis occurred. Average wealth then dipped slightly to $802,000 in 2011-12 before rising again to $936,000 in 2015-16.
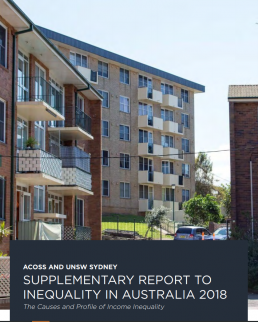
Inequality in Australia 2018 supplementary report
Download this at https://www.acoss.org.au/wp-content/uploads/2018/07/Inequality-in-Australia-2018_supplementary-report.pdf