
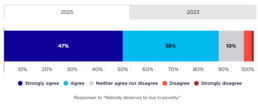
Community attitudes towards "nobody deserves to live in poverty"
This chart shows the responses in our Community attitudes towards poverty and inequality survey to the phrase Nobody deserves to live in poverty In both 2023 and 2025, 86% of people in Australia agreed that nobody deserves to live in poverty.
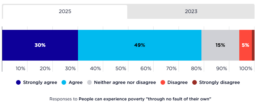
Community attitudes towards "people can experience poverty through no fault of their own"
This chart shows the responses in our Community attitudes towards poverty and inequality survey 2023 to the idea that people can experience poverty "through no fault of their own. In 2025, 79% of people in Australia agreed that people can experience poverty "through no fault of their own." In 2023, 81% of people in Australia agreed that people can experience poverty "through no fault of their own." Note that the wording used for these questions has been chosen as common in public discussion.
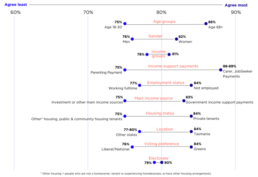
Demographic distribution of community attitudes towards "people can experience poverty through no fault of their own"
This chart shows the demographic distribution of responses in our Community attitudes towards poverty and inequality survey to the idea that people can experience poverty "through no fault of their own. By age: Agreement with this statement differed by age, with people aged 68 and above agreeing most (86%) and people aged 18 to 30 agreeing least (75%). By gender: More women agreed with this statement (82%) than men (76%). By income: Differences in agreement by income quintile were small (78–81%). By income support payment: People in the lowest income quintile who were receiving carer payments (89%) or JobSeeker (88%) agreed most, and people receiving parenting payments agreed least (75%). By employment status: People who were not employed agreed most (84%) and people who worked full-time agreed least (77%). By income source: People who were receiving government income support payments agreed most (83%) and people with investment or other main income sources agreed least (75%). By…
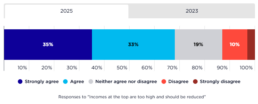
Community attitudes towards "Incomes at the top are too high"
This chart shows the responses in our Community attitudes towards poverty and inequality survey to the phrase incomes at the top are too high. In 2025, 68% of people in Australia agreed that the incomes of those with the most are too high. In 2023, 63% of people in Australia agreed that the incomes of those with the most are too high and should be reduced. Note: Question wording in 2023 survey was incomes at the top are too high and should be reduced and in the 2025 survey was incomes at the top are too high
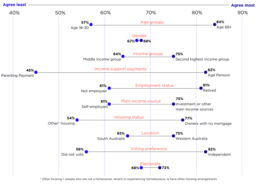
Demographic distribution of community attitudes towards "Incomes at the top are too high"
This chart shows the demographic distribution of responses in our Community attitudes towards poverty and inequality survey to the phrase incomes at the top are too high. By age: Agreement increased markedly by age group, from 57% (aged 18 to 30) to 84% (aged 68 and above). By gender: Agreement was largely consistent between women (67%) and men (68%). By income: Differences varied when compared by income, with people in the second income quintile agreeing most (75%) and people in the third (middle) income quintile agreeing least (64%). By income support payment: People in the lowest income quintile who were receiving the age pension agreed most (82%), compared with those receiving parenting payments (45%), or carer, JobSeeker and disability payments (58–72%). By employment status: People who had retired agreed most (81%) and people who were not employed agreed least (61%). By income source: People who had investment or other main income sources agreed most (75%) and people…
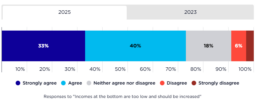
Community attitudes towards "incomes at the bottom are too low"
This chart shows the responses in our Community attitudes towards poverty and inequality survey to the concept of whether incomes at the bottom are too low. In 2025, 73% of people in Australia agreed that incomes at the bottom are too low and should be increased. In 2023, 76% of people in Australia agreed that incomes at the bottom are too low and should be increased. *Note: Question wording in the 2023 survey was Incomes at the bottom are too low and should be increased
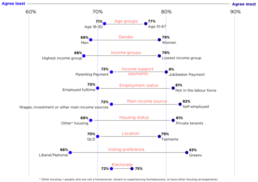
Demographic distribution of community attitudes towards "incomes at the bottom are too low"
This chart shows the responses in our Community attitudes towards poverty and inequality survey to the concept of whether incomes at the bottom are too low. By age: People aged 51 to 67 agreed most (77%) and people aged 18 to 30 agreed least (71%). By gender: More women agreed with this statement (79%) than men (69%). By income: People in the lowest income quintile agreed most (79%) and people in the highest income quintile agreed least (68%). By income support payment: People in the lowest income quintile who were receiving JobSeeker agreed most (80%) and people receiving parenting payments agreed least (72%). By employment status: People who were not in the labour force agreed most with this statement (81%) and people who were employed full-time agreed least (70%). By income source: People who were self-employed agreed most (82%) and people receiving wages or with investment or other main income sources agreed least (72%). By housing tenure: Tenants in private housing agreed…
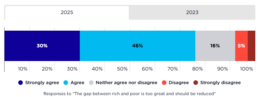
Community attitudes towards "the gap between the wealthy and those in poverty is too great and should be reduced"
This chart shows the responses in our Community attitudes towards poverty and inequality survey 2023 to the idea that The gap between rich and poor is too great and should be reduced. In 2025, 76% of people agreed that the gap between the wealthy and those living in poverty is too great and should be reduced. In 2023, 74% of people agreed that the gap between the wealthy and those living in poverty is too great and should be reduced.
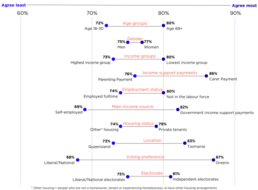
Demographic distribution of community attitudes towards "the gap between the wealthy and those in poverty is too great and should be reduced"
This chart shows the demographic distribution of responses in our Community attitudes towards poverty and inequality survey 2023 to the idea that The gap between rich and poor is too great and should be reduced. By age: Agreement increased by age group, from 72% (aged 18 to 30) to 80% (aged 68 and above). By gender: Women (77%) and men (75%) had similar levels of agreement. By income: Agreement decreased by income group, from 80% (lowest quintile) to 73% (highest quintile). By income support payment: People in the lowest income quintile who were receiving carer payments agreed most (86%) and people receiving parenting payments agreed least (76%). By employment status: People who were not in the labour force agreed most (80%) and people in full-time employment agreed least (74%). By income type: People receiving government income support payments agreed most (82%) and people who were self-employed agreed least (69%). By housing tenure: Tenants in private rental agreed most (79%)…
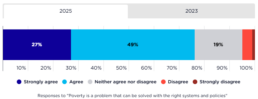
Community attitudes towards "poverty is a problem that can be solved with the right systems and policies"
This chart shows the responses in our Community attitudes towards poverty and inequality surveys to the idea that Poverty is a problem that can be solved. [infogram id="_/mNcbNl44oSEvjjeQgZAF" prefix="OFN" format="interactive" title="Poverty can be solved with the right systems and policies_2023 and 2025"] 2025: It shows that 76% of people in Australia agreed that poverty is a problem that can be solved with the right systems and policies 2023: It shows that 75% of people in Australia agreed that poverty is a problem that can be solved with the right systems and policies.