
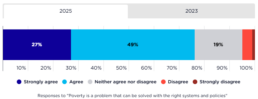
Community attitudes towards "poverty is a problem that can be solved with the right systems and policies"
This chart shows the responses in our Community attitudes towards poverty and inequality surveys to the idea that Poverty is a problem that can be solved. [infogram id="_/mNcbNl44oSEvjjeQgZAF" prefix="OFN" format="interactive" title="Poverty can be solved with the right systems and policies_2023 and 2025"] 2025: It shows that 76% of people in Australia agreed that poverty is a problem that can be solved with the right systems and policies 2023: It shows that 75% of people in Australia agreed that poverty is a problem that can be solved with the right systems and policies.
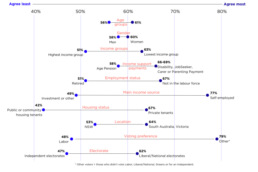
Demographic distribution of community attitudes towards "government policies have caused some people to experience poverty"
This chart shows the demographic distribution of responses in our Community attitudes towards poverty and inequality survey to the statement Government policies have caused some people to be poor By age: Agreement with this statement was largely consistent across age groups (56–61%). By gender: Women (60%) and men (58%) had similar levels of agreement. By income: Agreement differed by income level, ranging from 63% of people in the lowest income quintile to 51% in the highest income quintile. By income support payment: People in the lowest income quintile who were receiving disability, JobSeeker, carer, or parenting payments agreed more (66–69%) than those receiving the age pension (58%). By employment status: People who were not in the labour force agreed most (67%) and people who had retired agreed least (51%). By income source: People who were self-employed agreed most (77%) and people with investment or other main income sources agreed least (49%). By housing status: Tenants…
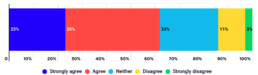
Community attitudes towards "government policies have caused some people to experience poverty"
This chart shows the responses in our Community attitudes towards poverty and inequality survey to the statement Government policies have caused some people to be poor 2025: 60% of people in Australia agreed that government policies have caused some people in Australia to be poor.2023: 62% of people in Australia agreed that government policies have caused some people in Australia to be poor.
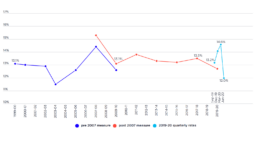
Comparison of poverty trend and SDG target path
This chart shows the percentage of people in poverty between 1999-20 to 2019-20 and compares this with the percentage of people in poverty if we were following the target set out in the UN Sustainable Development Goals, of which Australia is a signatory. The Sustainable Development Goal on poverty includes: "By 2030, reduce at least by half the proportion of men, women and children of all ages living in poverty in all its dimensions according to national definitions" (note that this chart uses 50% of median income in lieu of an accepted national definition of poverty in Australia).
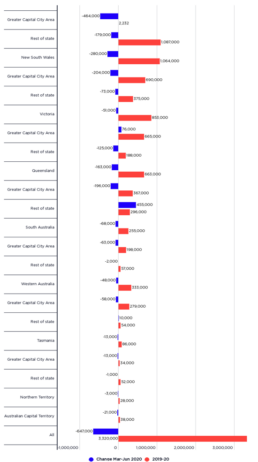
Rate of people in poverty by location
In both 2022-23 and 2019-20, poverty was higher among people living in capital cities than living outside them, reflecting the concentration of Australia's population in our largest cities. In 2022-23, poverty rates were highest in non-urban areas in Western Australia (24% or 120,000 people), South Australia (25% or 95,000 people) and Northern Territory (24% or 48,000 people).
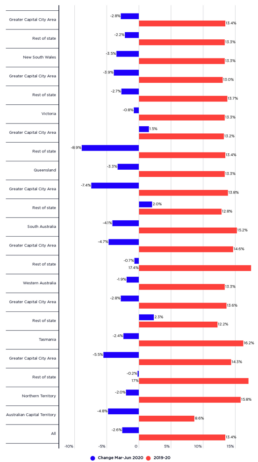
Number of people in poverty by location
2022-23 ('000s of people in poverty) 2,457,000 people in poverty lived in capital cities in 2022-23, reflecting the concentration of Australia's population in our largest cities. Poverty rates were highest in non-urban areas in Western Australia ( 120,000 people), South Australia ( 95,000 people) and Northern Territory (48,000 people). 2019-20 Poverty was somewhat higher (at 13.4%) among people living in capital cities than among those living outside them (13.3%). Two thirds (67%) of people in poverty lived in capital cities, which is broadly equivalent to the population share living in those cities. Poverty rates were highest in non-urban areas in the smallest States and Territories, including 17.7% outside the capital in Tasmania, 17.4% outside the capital in South Australia, and 15.8% in the Northern Territory. The greatest reductions in poverty in the fourth quarter of 2019-20 occurred outside the capital in Victoria (by 8.9%), in Brisbane (by 7.4%), in Hobart (by 5.5%), and in…
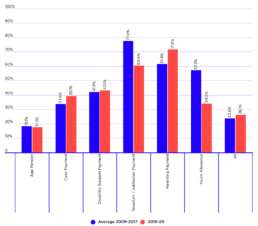
Poverty in income support households (2019-20 compared with previous years - % of people)
[infogram id="_/xpK6KE5DvVVhehHR4KcA" prefix="knM" format="interactive" title="2019-20_Poverty by age and family type compared with previous years"] Poverty was higher overall in 2019-20 in ‘income support households’, with large increases for those reliant on Parenting Payment and Carer Payment, but much lower in those relying mainly on JobSeeker Payment and Youth Allowance.
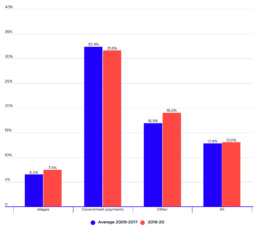
Poverty by main household income (2019-20 compared with previous years - % of people)
[infogram id="_/zcap0aUy5zdrAjbshpOE" prefix="RRT" format="interactive" title="2019-20_Poverty by main household income compared with previous years"] Poverty was significantly lower in 2019-20 compared with previous years for people relying mainly on social security payments, but higher among those relying mainly in wages and ‘other’ incomes (including investment income).