
Inequality in Australia 2020, Part 2: Who is affected and why
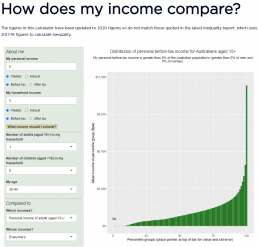
Read the report: Inequality in Australia 2020, Part 2: Who is affected and why Where do you stand in Australia's income distribution? Find out now with our income calculator!

Trends in wealth inequality (Gini coefficient) by asset type
[infogram id="_/pLLmrjoss723BOzvS5ux" prefix="TF5" format="interactive" title="2017-18: Fig.20_Trends in wealth inequality (gini coefficient) by asset type from 2003-04 to 2017-18"] This graph shows how wealth inequaltiy increased from 2003 to 2009, declined slightly after the Global Financial Crisis (GFC), and resumed its growth afterwards. During the boom years from 2003 to 2009, the Gini coefficient for wealth inequality increased from 0.57 to 0.62. After the GFC it fell back to 0.59, then continued to rise to reach 0.62 in 2017. This increase in wealth inequality was mainly generated by growth in the overall value of superannuation, shares and other financial investments, and investment property - all of which were relatively concentrated in the hands of high-wealth households from the outset (though they became less concentrated over time). Conversely, the proportion of wealth held in owner-occupied housing and other non-financial assets (which were more evenly distributed in…
Inequality in Australia 2020: Part 1 - Overview
Inequality in Australia 2020: Part 1, Overview Inequality in Australia 2020: Part 1, Overview. Supplementary Report - The impact of COVID-19 on income inequality Factsheet: Inequality in Australia 2020: Part 1, Overview Where do you stand in Australia's income distribution? Find out now with our income calculator!

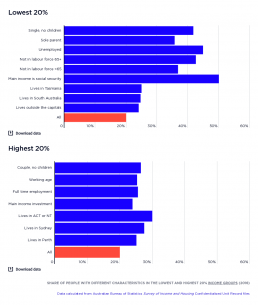
Share of people with different characteristics in the lowest and highest 20% income groups
[infogram id="_/k7PItYM11dctrnaS6qon" prefix="9Id" format="interactive" title="Fig.4_ Share of people with different characteristics in the lowest 20% of households (2016)"] The first half of this graph shows the share of each group of people with a particular characteristic who are in the lowest 20% income group of households. Older people, single people and sole parents, and those who rely mainly on government income support payments are more likely to be in the lowest 20% income group. The most important influence on incomes is labour force status. People living in households where the household reference person is not in the labour force or is unemployed are much more likely to be in the lowest 20% income group. People living in Tasmania and South Australia are also more likely to be in lowest 20%, along with people living outside capital cities. The second half of this graph shows that those more likely to be in the highest 20% income group are of working-age and in couple…
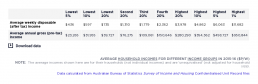
Average household incomes for different income groups
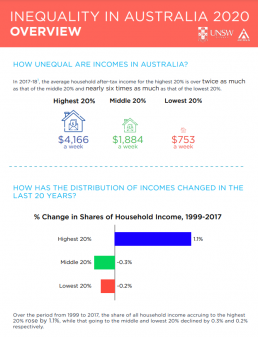
This table shows the average income of households in Australia, split by groups of 20% by income; as well as the highest and lowest 10% and 5% income groups. [infogram id="_/nYVwrntWRdPEhIvWChtu" prefix="FS4" format="interactive" title="Average household incomes for different groups in 2015-16 ($p/w)"] 2017-18: Somebody in the highest 20% group lives in a household with over twice the average weekly disposable income of the middle 20% ($4,166 per week compared with $1,884), and five times as much disposable income of a household in the lowest 20% ($753 per week). The average income of the middle 20% ($1,884a week) is two and half times that of the lowest 20% ($753). Income is heavily concentrated at the top: average income in the highest 5% (at $5,796) is more than one-and-a-half times the average of the highest 20%. 2015-16: This shows that somebody in the highest 20% group lived in a household with over twice the average weekly disposable income of the middle 20% ($3,978 per week…