
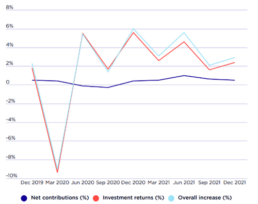
Cumulative growth in superannuation assets
[infogram id="_/0tz7xV9CUSBEcPcLQadu" prefix="IdH" format="interactive" title="Cumulative growth in superannuation assets"] Superannuation account balances vary over time through a combination of net contributions (contributions minus any benefit payments) and investment returns. Since most superannuation funds invest in a combination of shares, bonds, property and cash deposits, their average investment returns broadly reflect returns on those investments. As a proportion of their value in December 2019, superannuation account balances declined by 9% by March 2020 then rose to 18% above December 2019 levels by December 2021.
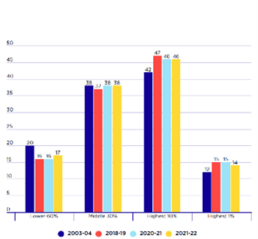
Changes in the distribution of wealth since 2003
[infogram id="_/42kg4tobDcX38c8UgCch" prefix="wlA" format="interactive" title="Increase in wealth by wealth group since 2003 %"] In 2003, wealth was shared very unequally. The highest 10% had 42% of all wealth, the middle 30% had 38% and the lower 60% had 20%. By 2018, the distribution was skewed even further towards the richest. The highest 10% had 47% of all wealth, the middle 30% had 37% and the lower 60% had 16%. During the COVID recession and recovery, wealth inequality moderated somewhat but wealth was still distributed more unequally than in 2003. By 2021, the highest 10% had 46% of all wealth, the middle 30% had 38% and the lower 60% had 17%.
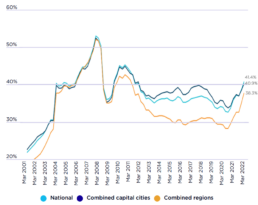
Proportion of median income required to pay a typical mortgage on a recently purchased home (%)
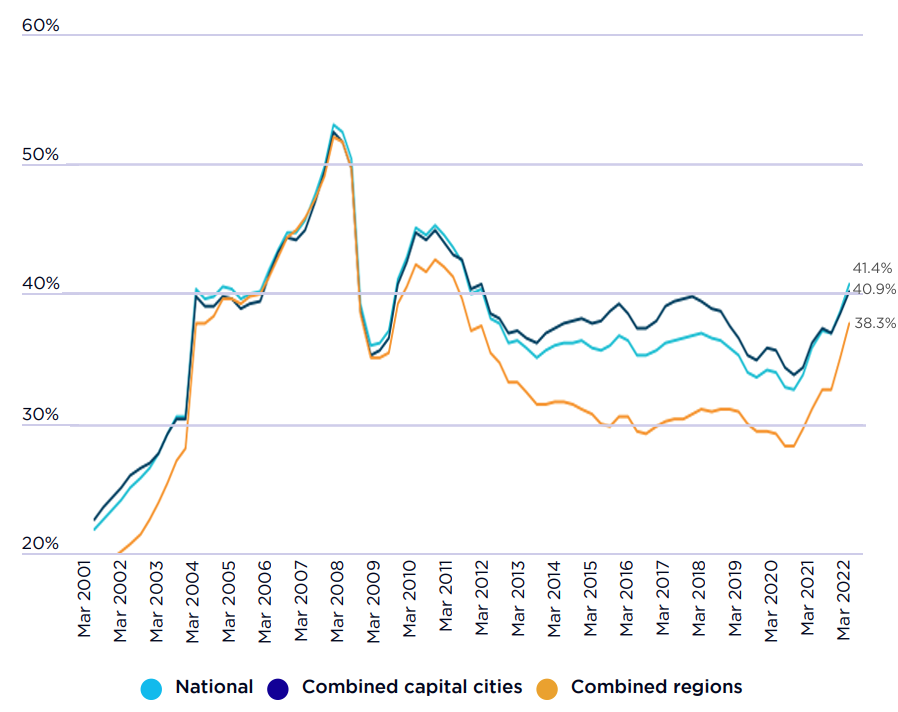 Source: ANZ Corelogic housing affordability report, March 2022 Note: Assumes owner has borrowed 80% of median dwelling value and is paying the average discounted variable mortgage for a term of 25 years. Percentage of median gross annual household income required to pay median rent on a new lease
This graph shows that the proportion of median household disposable income required to service a typical home mortgage rose from 27% to 41% between 2003 and 2021.
Source: ANZ Corelogic housing affordability report, March 2022 Note: Assumes owner has borrowed 80% of median dwelling value and is paying the average discounted variable mortgage for a term of 25 years. Percentage of median gross annual household income required to pay median rent on a new lease
This graph shows that the proportion of median household disposable income required to service a typical home mortgage rose from 27% to 41% between 2003 and 2021.
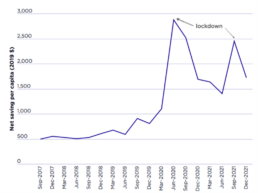
Net saving per capita
[infogram id="_/5XProYwUsMtRCj1shL9h" prefix="51m" format="interactive" title="Net saving per capita"] As outlined in our previous report on the impact of COVID on income inequality and poverty, public income supports such as JobKeeper Payment and the Coronavirus Supplement boosted the incomes of many low-income households while COVID restrictions reduced spending on such items as holidays, entertainment and eating out35. The result was a sharp increase in overall household saving.

Profile of household wealth in different countries in 2020 (% of all wealth)
[infogram id="_/f3Nw4ZTP5tFUR1C9g8lq" prefix="HEO" format="interactive" title="Profile of household wealth in different countries in 2020"] A relatively high proportion of household wealth in Australia (58%) is in non-financial assets - mainly housing - compared with a global average of 46%.

1280px-The_Guardian_2018.svg
Low-income tenants hardest hit as Australian rent rises outstrip assistance payments

COVID-19: Housing market impacts and housing policy responses - an international review
COVID-19: Housing market impacts and housing policy responses - an international review
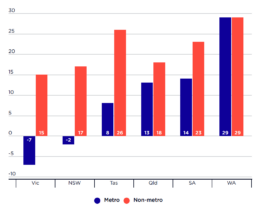
Median advertised rents by state/territory in Australia, 2019-2021
[infogram id="_/tl566KvdfglB4AhwWJTx" prefix="CIY" format="interactive" title="Figure 6.6 Median advertised rents, all property types, Australia"] This graph shows the phenomenon of regional rents ‘outperforming’ the relevant capital city in Australia from 2019-2021. This was especially marked in New South Wales (+17% versus-2%), Tasmania (+26% versus +8%) and Victoria (+15% versus -7%). Also notable is that Western Australia, where geographical isolation and a closed border largely enabled avoidance of economic restrictions during the first two years of the pandemic, the pattern was completely different.
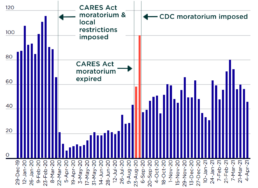
Weekly eviction filings in 2020 and 2021 as a % of pre-pandemic norm, USA
In the USA. series of eviction moratoriums from multiple agencies and levels of government were introduced over the period of the pandemic, many of which had lapsed by July 2020. Nationally, Congress included evictorion moratorium in the Coronavirus Aid, Relief and Economic Security (CARES) Act, which commenced on 27 March 2020. This appled to 'federally related properties', including propoerties supported by federally-backed finance or occupied by tenants with Housing Choice vouchers. For the properties it coered, it prohibited the commencement and enforcement of eviction proceedings for unpaid rent until 23 August 2020. From 4 September 2020, two weeks after the CARES Act expired, the CDC National moratorium was imposed, which covered all tenants meeting certain income and hardship criteria, including that they had applied for government assistance and would be at risk of homelessness or overcrowding if evicted. Tenants seeking the moratorium protection were required to declare…
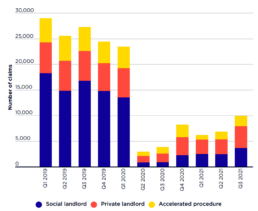
Possession Actions in England, 2019-2021
UK governments did not regulate rents during the emergency, and a public campaign for the suspension or cancellation of rent arrears was rejected. Instead, various measures of financial assistance were implemented: in March 2020, Local Housing Allowance was increased to cover 30% of market rents (restoring an earlier link, severed in 2016), and in late 2021 English local authorities were allocated additional funds to support low-income tenants still in rent arrears. The Scottish and Welsh Governments implemented loan schemes for the payment of arrears: the Scottish scheme paid up to nine months’ rent arrears, for repayment over a period of up to five years. Government data on termination proceedings (‘possession claims’) in England show a dramatic reduction in the pandemic period. Possession claims by all landlords in Q2 2020 were down 88% on the same quarter the previous year, and claims for 2020-21 were down 79% on the previous year; however, the largest reductions were by social…