
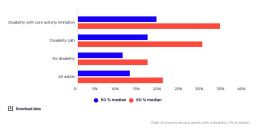
Rate of poverty among adults with disability
This graph looks at the poverty rate of people with disability. People with disability, especially those with more severe incapacities (people who are limited in the core activities they can perform) face an above-average risk of poverty. It is likely that poverty is underestimated amongst people with disability, as the extra costs of a disability are not taken into account when assessing whether people are living below the poverty line, such as the costs of adjustments to home or workplace; care costs; additional transportation costs; and medical and pharmaceutical costs. [infogram id="_/cxEJZ1fCSGWfr2PhCdBp" prefix="tyl" format="interactive" title="2017-18: Fig.20_Rate of poverty among adults with a disability (% of adults)"] 2017-18: The rate of poverty among adults with disability is 17.2% using the 50% median income poverty line and 28.4% using the 60% median income poverty line. 2015-16: The rate of poverty among adults with disability is 16.5% using the 50% median income…
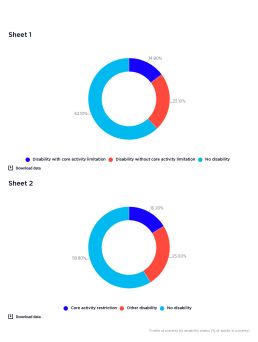
Profile of poverty among adults with disability
This graph shows the profile of households in poverty by the disability status of the main reference person. 2017-18 [infogram id="_/AgvpU1SCmc1s9ts5RPz8" prefix="FXm" format="interactive" title="2017-18: Fig.21_Profile of poverty by disability status (% of adults in poverty)"]This shows that 37% of people in poverty have disability using the 50% of median income poverty line; and 39% using the 60% median income poverty line. 2015-16 [infogram id="_/109miWknhgg8B2mQkyos" prefix="KGl" format="interactive" title="Fig.21_Profile of poverty by disability status (% of adults in poverty)"]This shows that 38% of people in poverty have disability using the 50% of median income poverty line; and 41% using the 60% median income poverty line. This reflects a combination of the overall rate of disability (18% of the total population in 2015), the higher rate of disability among people aged 65 and over, and the average risk of poverty among people with disability.
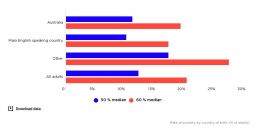
Rate of poverty by country of birth
This graph shows the poverty rate of people by their country of birth, divided into those born in Australia, those born in a mainly English-speaking country; and those born elsewhere. [infogram id="_/haiMIfXRgth1sw5muGUN" prefix="x7r" format="interactive" title="Fig.22_ Rate of poverty by country of birth (% of adults)"] 2017-18: The graph shows that people born overseas in a country where English is the main language have a much lower poverty rate – at 9.7% using the 50% median income poverty line and 15.9% using the 60% median income poverty line - compared with those born elsewhere – at 17.5% using the 50% median income poverty line and 27.1% using the 60% median income poverty line. 2015-16: The graph shows that people born overseas in a country where English is the main language have a much lower poverty rate – at 10% using the 50% median income poverty line and 17% using the 60% median income poverty line - compared with those born elsewhere – at 17% using the 50% median income…
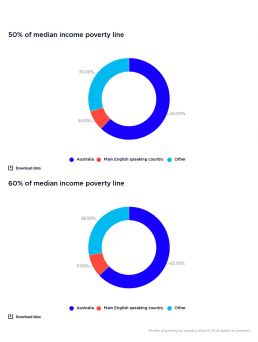
Profile of poverty by country of birth
This graph shows the profile of adults in poverty by their country of birth. 2017-18 [infogram id="_/x8EkcVfF4WZ7dTf4bsnc" prefix="s9W" format="interactive" title="2017-18: Fig.23_Profile of poverty by country of birth (% of adults in poverty)"]This graph shows that the majority of adults in poverty are people born in Australia (59.3% of 50% median income poverty line and 59.4% of 60% median income poverty line), due to the higher proportion of adults born in Australia. 2015-16 [infogram id="_/z5n2e1zhnRxE8aO31j5T" prefix="vbK" format="interactive" title="Fig.23_Profile of poverty by country of birth (% of adults in poverty)"]This graph shows that the majority of adults in poverty are people born in Australia (62% of 50% median income poverty line and 63% of 60% median income poverty line), due to the higher proportion of adults born in Australia.
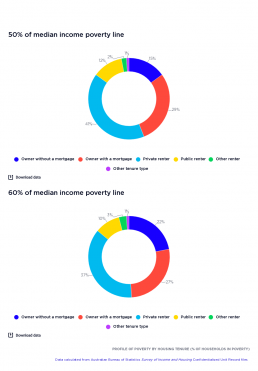
Profile of poverty by housing tenure
This shows the profile of adults in poverty by their type of housing occupation - whether they own their home with or without a mortgage; whether they rent either privately or publicly; or whether they have another form of occupation type. 2017-18[infogram id="_/1IGrtlnnVvLB2M6vHvuQ" prefix="f8A" format="interactive" title="2017-18: Fig.25_Profile of poverty by housing tenure (% of households in poverty)"] This graph shows that approximately half of all households living below the poverty line were renting, at 49% using the 50% median income poverty line and 45% using the 60% median income poverty line. 2015-16[infogram id="_/xRAf1rv8kdYKi06a2WS7" prefix="N1X" format="interactive" title="Fig.25_Profile of poverty by housing tenure (% of households in poverty)"] This graph shows that approximately half of all households living below the poverty line were renting, at 53% using the 50% median income poverty line and 47% using the 60% median income poverty line. This shows that renters…
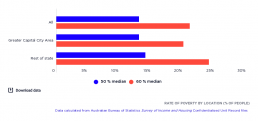
Rate of poverty by location
This graph shows the rate of poverty by location. It shows that poverty is significantly higher among people living outside capital cities than those who live in capital cities. In 2022-23, poverty rates were highest in non-urban areas in Western Australia (24%), South Australia (25% ) and Northern Territory (24%). On the other hand, two thirds (66%) of people in poverty lived in capital cities, reflecting the concentration of Australia’s population in our largest cities.
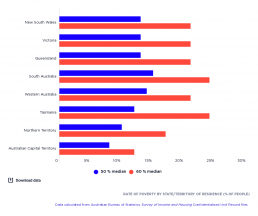
Rate of poverty by state/territory of residence
This graph compares average poverty rates in the eight states and territories. [infogram id="_/sipUXAKN84ZEJUXDNbdt" prefix="MPZ" format="interactive" title="Fig.27_Rate of poverty by State/Territory of residence (% of people)"] NOTE: These average figures mask income disparities among different groups in the community. For example, Aboriginal and Torres Strait Islander people represent 30 per cent of the Northern Territory population of 245,740 people. In the Northern Territory, as elsewhere, there are substantial income disparities between Aboriginal and Torres Strait Islander people and the rest of the population. In 2016, median personal income for Indigenous individuals was $281 per week, just 26% of the $1,072 received by other Northern Territorians. Altman J (2017), Deepening Indigenous poverty in the Northern Territory, 14th November 2017. College of Asia and the Pacific, Australian National University.
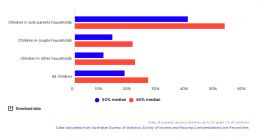
Rate of poverty among children
This graph shows the rate of poverty among all children according to the 50% and 60% median income poverty lines, in 2017-18 and 2015-16. [infogram id="_/eC1hjUWE0eIHjlrZoM9u" prefix="o0W" format="interactive" title="2017-18: Fig.7_Rate of poverty among children up to 15 years (% of children)"] In 2017-18, 17.7% of all children were living in households experiencing poverty, rising to 25.7% when the 60% poverty line is used. The risk of poverty is highest for children in sole parent families, which is three times that for children in couple families according to the 50% poverty line (44.2% compared with 12.7%). In 2015-16, 17.3% of all children were living in households experiencing poverty, rising to 26% when the 60% poverty line is used. The risk of poverty is highest for children in sole parent families, which is three times that for children in couple families according to the 50% poverty line (39.4% compared with 13.1%).
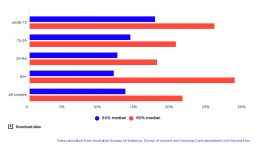
Rate of poverty by age (% of people)
[infogram id="_/AyvOZ9nEyc2fWJje7mMu" prefix="jYe" format="interactive" title="2017-18_ Fig.5_Rate of poverty by age (% of people)"] This graph displays the rate of poverty among all people by age groups. 2017-18: Among children, the rate of poverty is 17.7% based on the 50% of median income poverty line, and 25.5% when using the 60% poverty line. The poverty rate among young people (15-24 years) is also above average at 13.9% (20.2% when the 60% of median income poverty line is used). Among people aged 25 to 64 years, poverty rates are somewhat lower (at 12.1% and 17.6% at the 50% and 60% of median income poverty lines respectively). People 65 years and over who own or are buying their home are less likely to experience poverty than the rest of the population when the 50% poverty line is used (10.3%) but more likely when the 60% poverty line is used (23.7%). This figure also shows the profound impact of housing costs on poverty rates among older people by displaying the poverty rate…
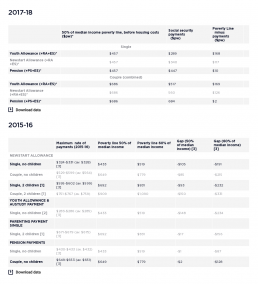
Comparison of selected income support payments and poverty lines, 2015-16 and 2017-18
[infogram id="_/gT0wxbRQcIPXDYZI1G7R" prefix="eMn" format="interactive" title="Table 3: Comparison of social security payments"] High levels of poverty among households reliant on income support payments are due in part to the level of these payments, which generally sits below the poverty line. A household reliant on income support payments usually needs extra income such as part-time earnings to avoid poverty. How much extra income is needed depends on the difference between the payments and the poverty line, and also on housing costs (which are taken into account in this research). This table compares the standard maximum rates of major income support payments with before-housing poverty lines in 2015-16 and 2017-18. In this case, the gaps between maximum payment rates and poverty lines are based on a cameo family type with no private income, so they do not take account of the private incomes and housing costs of families in the ABS income survey sample.