
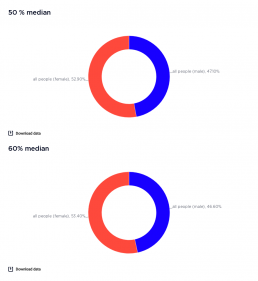
Profile of poverty by gender
These graphs show the number of people living in poverty divided into binary gender groups according to the 50% and 60% median income poverty lines in 2015-16 and 2017-18. Because this website focuses on household incomes, the gap between male and female poverty rates is much less than the gender gap in personal incomes. 2017-18 [infogram id="_/VNvBK2xQQ8jXSWv9Miu8" prefix="Xl0" format="interactive" title="Profile of poverty by gender (% of men and women in poverty), 50% median income poverty line"]This graph shows that a higher share of people in poverty are female – 42.9% compared with 47.1% based on the 50% of median income poverty line, or 53.4% compared with 46.6% using the 60% of median income poverty line. 2015-16 [infogram id="_/YCp67v1XJtNtaVYdu80c" prefix="SLJ" format="interactive" title="Fig.10_Profile of poverty by gender (% of men and women in poverty)"]This graph shows that a higher share of people in poverty were female – 51.5% compared with 48.5% based on the 50% of…
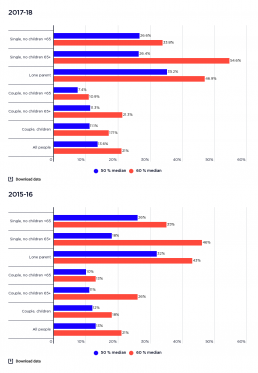
Rate of poverty by family type
This graph shows the rate of poverty for all people by family type. [infogram id="_/C1TU405XKpwg2I8e7Gfn" prefix="PPh" format="interactive" title="2017-18: Fig.9_Rate of poverty by family type (% of households)"] 2017-18: This shows that the family type with the highest rate of poverty is sole parent families – 35.2% based on the 50% of median income poverty line and 46.9% based on the 60% of median income poverty line. Single persons living alone also have relatively high poverty rates, which reflects their limited opportunity to benefit from economies of scale in living costs and reliance on a single income. When the 50% poverty line is used, single adults under 65 years have a higher rate of poverty (26.6%) than those 65 years and older (26.4%), but these rankings are reversed when the 60% poverty line is used (33.4% compared with 54.6%). 2015-16: This shows that the family type with the highest rate of poverty is sole parent families – 32% based on the 50% of median income…
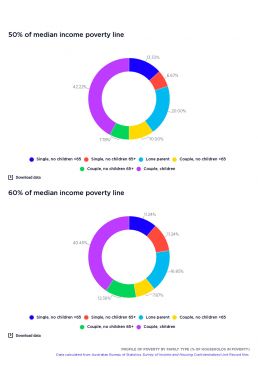
Profile of poverty by family type (% of households in poverty)
These graphs display the number of people already living in poverty, divided into household groups by 50% median income and 60% median income poverty lines, firstly in 2017-18 and then in 2015-16. 2017-18 [infogram id="_/bU3Xqx2iIXws06rmmbbS" prefix="Vqk" format="interactive" title="Profile of poverty by family type (% of households in poverty), 50% median income poverty line"]This shows that couple households with children, due to their larger share of the overall population, are the largest group in poverty, at 33.9% using the 50% of median income poverty line and 33.7% using the 60% of median income poverty line. Sole parent families are strongly over-represented among those in poverty, at 18% using the 50% median income poverty line and 15.5% using the 60% median income poverty line. 2015-16 [infogram id="_/XcDde09uFSnHzssH7R3n" prefix="Be2" format="interactive" title="Fig.12_Profile of poverty by family type (% of households in poverty)"]This shows that couple households with…
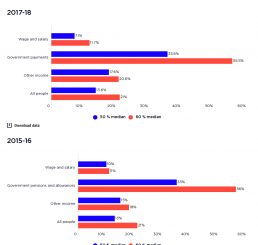
Rate of poverty by main income source
This graph shows the rate of poverty in households by their main income source. It shows that households relying mainly on social security payments are approximately five times more likely to experience poverty than those relying mainly on wages and salaries. [infogram id="_/VTCCXjSUZb2pUKDLDfxL" prefix="U3S" format="interactive" title="Fig.13_ Rate of poverty by main income source (% of households)"] 2017-18: Those relying on social security payments represent 36% using the 50% of median income poverty line and 56% using the 60% of median income poverty line, whilst those relying mainly on wages and salary represent 7% using the 50% of median income poverty line and 12% using the 60% of median income poverty line. 2015-16: Those relying on social security payments represent 35% using the 50% of median income poverty line and 56% using the 60% of median income poverty line, whilst those relying mainly on wages and salary represent 7% using the 50% of median income poverty line and…
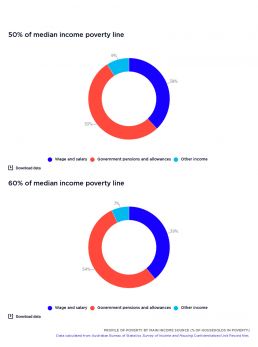
Profile of poverty by main income source
This graph shows the profile of households in poverty by their main income source in 2017-18 and 2016-17. It shows that the largest group of households in poverty is that relying on social security. 2017-18 [infogram id="_/9Hz2sXb7F8L6HnZsL5e4" prefix="sHG" format="interactive" title="2017-18_ Profile of poverty by main income source (% of households in poverty)"] Households relying on social security represent 51% of households in poverty when the 50% and 60% median income poverty lines are used. The share of households living in poverty who are reliant on mainly on wages is significant, reflecting the higher share of wage-earning households overall. This group represents 38% of households in poverty using the 50% median income poverty line and 40% using the 60% of median income poverty line. 2015-16 [infogram id="_/fjbtAsdFO5dXwmxOXIg8" prefix="pta" format="interactive" title="Fig.14_ Profile of poverty by main income source (% of households in poverty)"]Households relying on social…
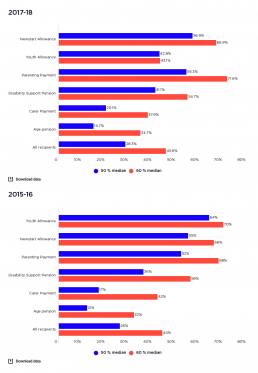
Rate of poverty by income support payment
This graph shows the poverty rates for people in households whose reference person receives an income support payment. [infogram id="_/hqvEV9k1bgKHSFxqm1fu" prefix="Sep" format="interactive" title="Fig.15_ Rate of poverty by income support received by household reference person"]2017-18: For all payments, poverty rates average 28% based on the 50% median income poverty line and 46% based on the 60% median income poverty line. The highest poverty rates are for Newstart Allowance recipients (57% based on 50% median income poverty line and 67% based on 60% median income poverty line) and for Parenting Payment (54% based on 50% median income poverty line and 72% based on 60% median income poverty line). Poverty rates in households where the reference person receives Youth Allowance are slightly lower but still substantial (at 43% based on both the 50% and 60% median income poverty lines). 41% of people in households whose reference person receives Disability Support Pension are in poverty…
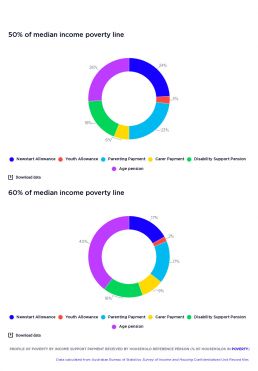
Profile of poverty by income support payment
These graphs show the poverty rate of households that receive income support payments. 2017-18 [infogram id="_/j8rbRMkd3KVr8IBUUzfN" prefix="3kq" format="interactive" title="2017-18_50% only: Fig.12_ Profile of poverty income support received by household reference person (% of households in poverty)"]Those in households whose reference person receives the Age Pension are the largest group (28% using the 50% median income poverty line and 40% using the 60% median income poverty line), since the overall Age Pension population is larger than for other payments. This is followed by Newstart Allowance (24% using the 50% median income poverty line and 18% using the 60% median income poverty line), Parenting Payment (23% using the 50% median income poverty line and 18% using the 60% median income poverty line) and Disability Support Pension (17% using the 50% median income poverty line and 14% using the 60% median income poverty line). 2015-16 [infogram id="_/DwD5xaA4JA3ZavfqzoiZ"…
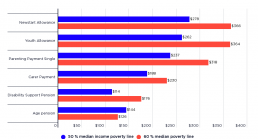
Poverty gaps by income support payment
The poverty gap measures the average depth of poverty among households below the poverty line by looking at the difference between their incomes and the poverty line. A large poverty gap shows that the majority of those in poverty are likely to have incomes well below the poverty line. Poverty gaps decline whenever the income of anyone below the poverty line increases, whereas poverty rates only decline when income increases by enough to raise someone from below the poverty line to above it. Thus both poverty rates and poverty gaps are important when looking at poverty. This graph and table show poverty gaps for people in households living below the poverty line when the reference person receives one of the listed income support payments. It is important to read these in conjunction with the poverty rates for that particular group. 2017-18 [infogram id="_/PBIgwcuSic2qD5AFSOcT" prefix="dxe" format="interactive" title="50 & 60 Average gap between income of those below…
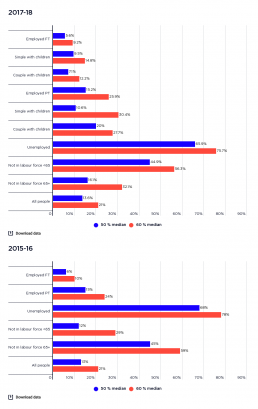
Rate of poverty by labour force status
This graph compares poverty rates among people according to the labour force status of the household reference person. [infogram id="_/fDf9eg6ePgRurKGYJuGK" prefix="FC9" format="interactive" title="2017-18: Fig.18_Rate of poverty by labour force status of household reference person (% of people)"] 2017-18: People who are of working age but who are lacking paid employment face an elevated risk of poverty, at 66% using the 50% of median income poverty line and 76% using the 60% of median income poverty line. Where the reference person is aged under 65 and is not in the labour force, 45% of households are in poverty using the 50% of median income poverty line; and 56% using the 60% of median income poverty line. Many of these households have a reference person with a disability or with caring responsibilities and rely on payments such as Disability Support Pension, Parenting Payment or Carer Payment. Poverty rates are much lower where the household reference person is employed fulltime…
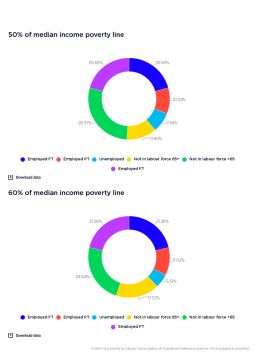
Profile of poverty by labour force status
These graphs show the profile of households in poverty by the labour force status of the household reference person. 2017-18 (All people) [infogram id="_/KOubd9U9MDbUTowEXixj" prefix="mbP" format="interactive" title="_Profile of poverty by labour force status, 50% median income poverty line, all people"] Although households that rely on paid employment have a much lower rate of poverty, they make up 38% of all people below the 50% median income poverty line, and 42% of all people below the 60% median income poverty line. 2017-18 (Employed fulltime) [infogram id="_/fkwaVnPAqgnJAv3Nh4v3" prefix="XgN" format="interactive" title="Profile of poverty by labour force status, fulltime, 50% median income poverty line"] 2017-18 (Employed parttime) [infogram id="_/vDCYZt8Dp01ntEpyaiZ7" prefix="J1v" format="interactive" title="Profile of poverty by labour force status, part time, 50% median income poverty line"] 2015-16 [infogram id="_/je9xnvNL1iAu8dEAhCHV" prefix="aKi" format="interactive"…